During all these years adventuring with data, science and design, I’ve been able to turn my ideas into reality. Currently I work as a Data Analyst at Vitru Education!
First of all, this entire website was made by me using R, Quarto and HTML!
Follow me on my social networks and see what I’ve been up to over the last few years!
Almost everything I know today about programming I learned from tutorials, so I really enjoy passing on this knowledge to people, teaching them about the process of creating charts and other tools.
I love to share my scripts, so anyone can learn the same way I did!
Here is an example
Boa constrictor 🐍
Click to view the code
# packages ----------------------------------------------------------------library(dplyr)library(ggplot2)library(geomtextpath)# data --------------------------------------------------------------------data <-data.frame(a =c(2.8,2.8,3.8,2.9,2.8,3,4.5,5.6,5.7,4.4,5.8))quote <-"'My drawing was not a picture of a hat. It was a picture of a <i>Boa constrictor</i> digesting an elephant.'"# plot --------------------------------------------------------------------data %>%ggplot(aes(x = a))+geom_density(adjust =1,fill ="#784707",color ="#462e0a",size =3)+geom_textdensity(size =5, fontface =2, spacing =30,vjust =-0.35, hjust =0.2,label = quote,color ="#462e0a",rich =TRUE)+geom_segment(x =-2.5, xend =12, y =0, yend =0,size =3, color ="#462e0a",lineend ="round")+geom_point(x =11.95, y =0.002, size =0.5)+annotate("text", x =12, y =0, label ="- The Little Prince by\nAntoine de Saint-Exupéry\nBruno Mioto - @BrunoHMioto",hjust =1, vjust =1.2, fontface ="bold",color ="#462e0a")+scale_y_continuous(expand =c(0,0))+scale_x_continuous(limits =c(-2.5,12))+theme_void()+theme(panel.background =element_rect(fill ="#f7f8f8", color =NA) )+coord_cartesian(ylim =c(-.4,0.8), xlim =c(-4,13))ggsave("elephant.png", width =10, height =6)
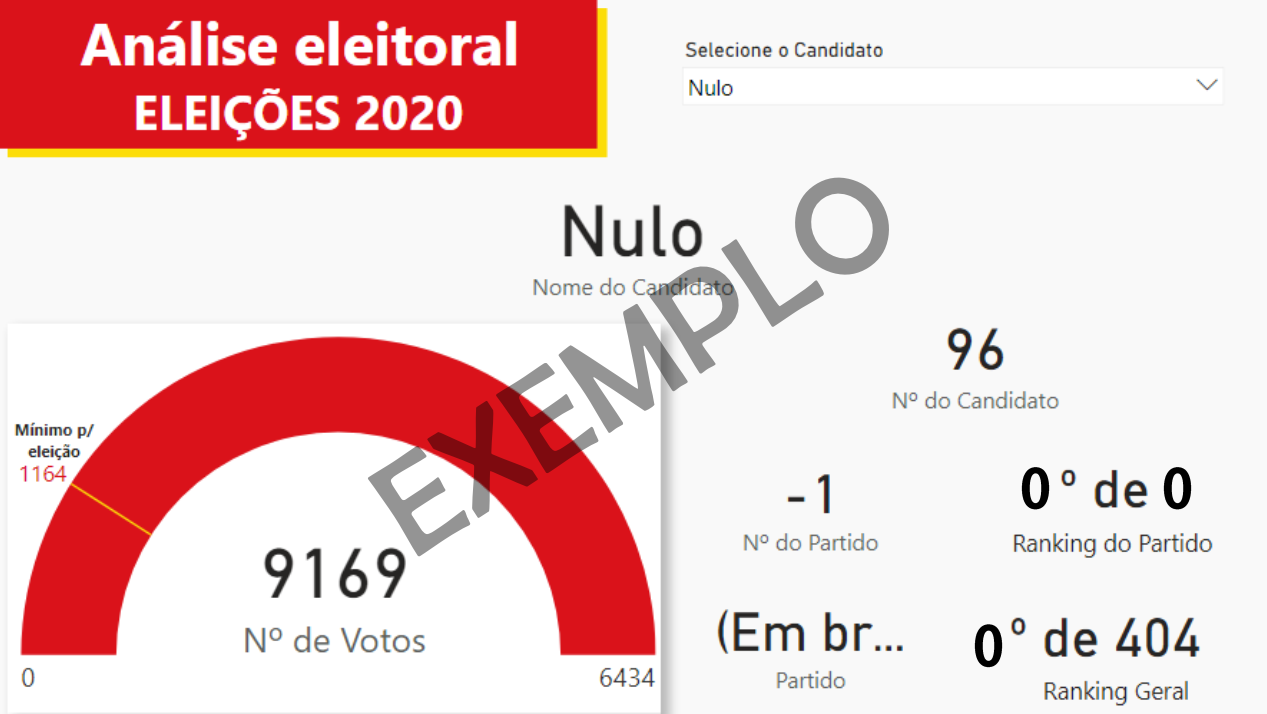
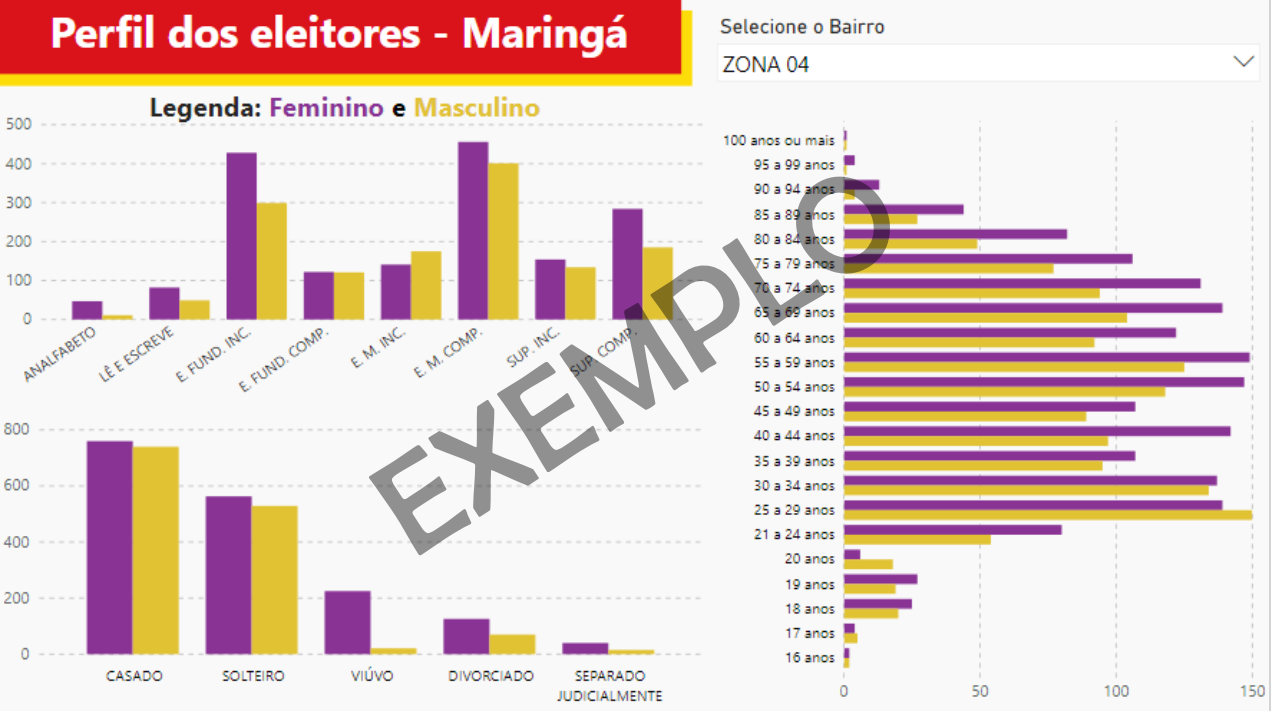
I’m a Power BI Data Analyst Associate (PL-300) certified by Microsoft. I use Power BI daily at work to create dashboards for the logistics sector and understand KPIs for transportation, production, and much more!
I also made a dashboard for the 2020 Municipal Elections in my city using Power BI. (Unfortunately I no longer have the license and only have screenshots)
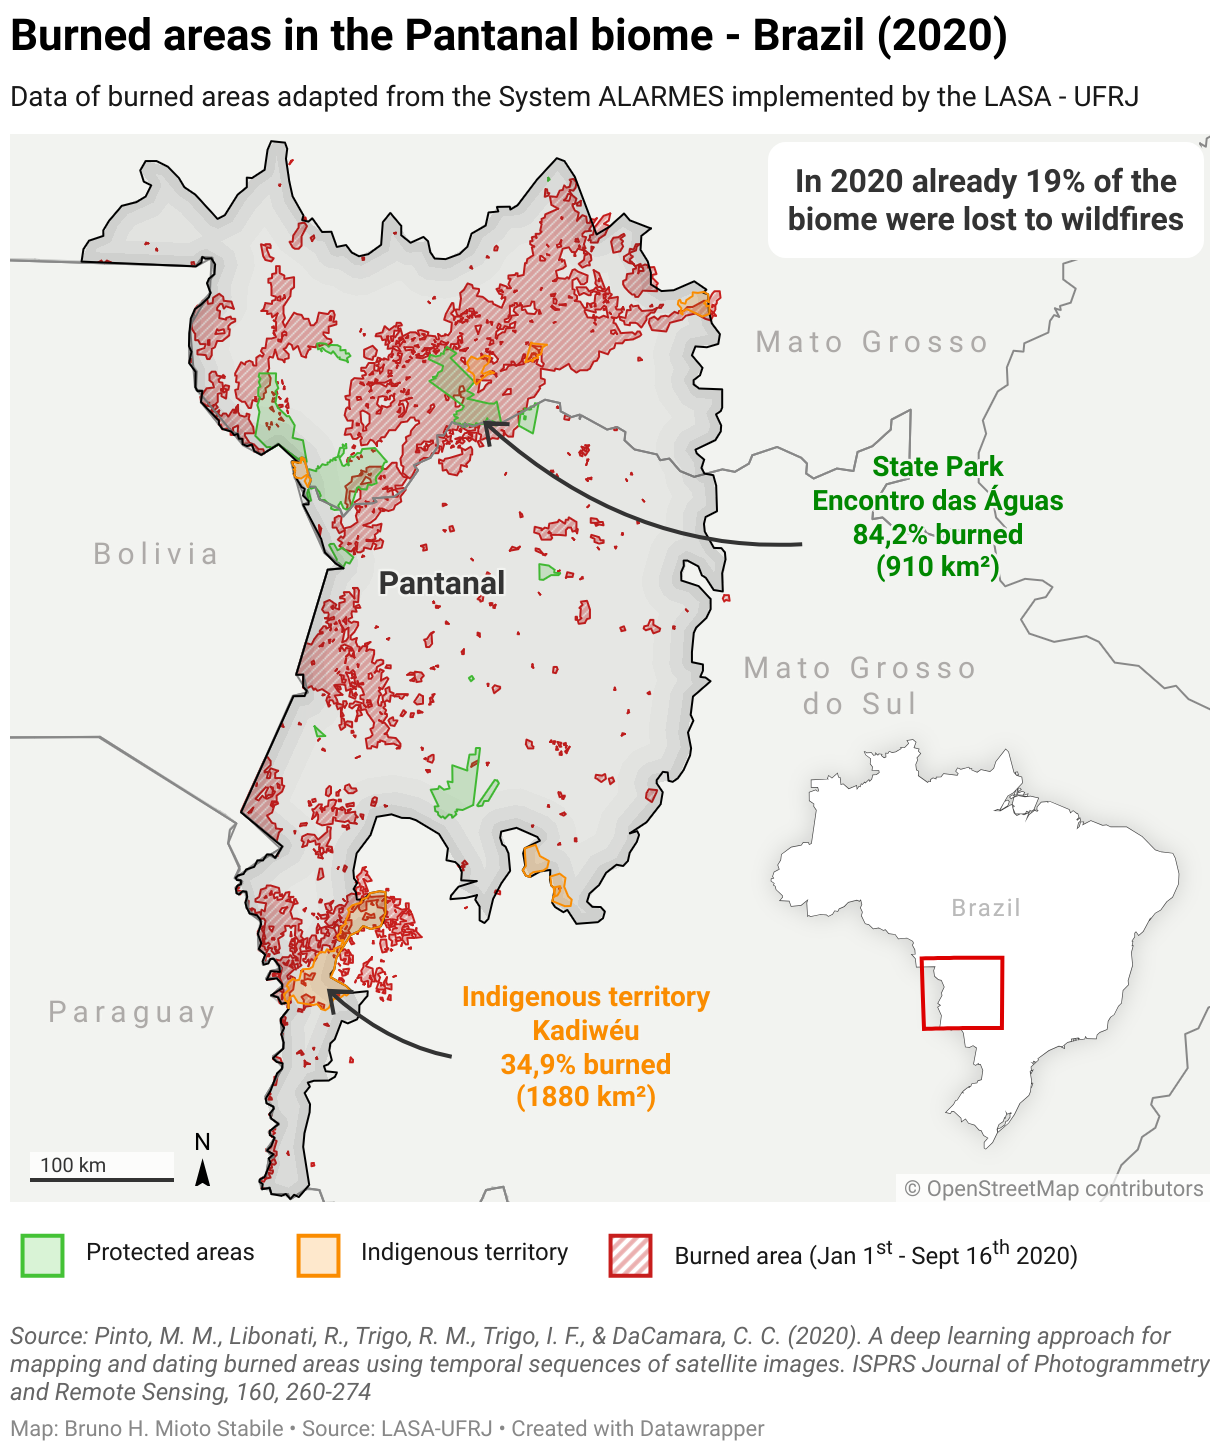
Datawrapper
Published charts
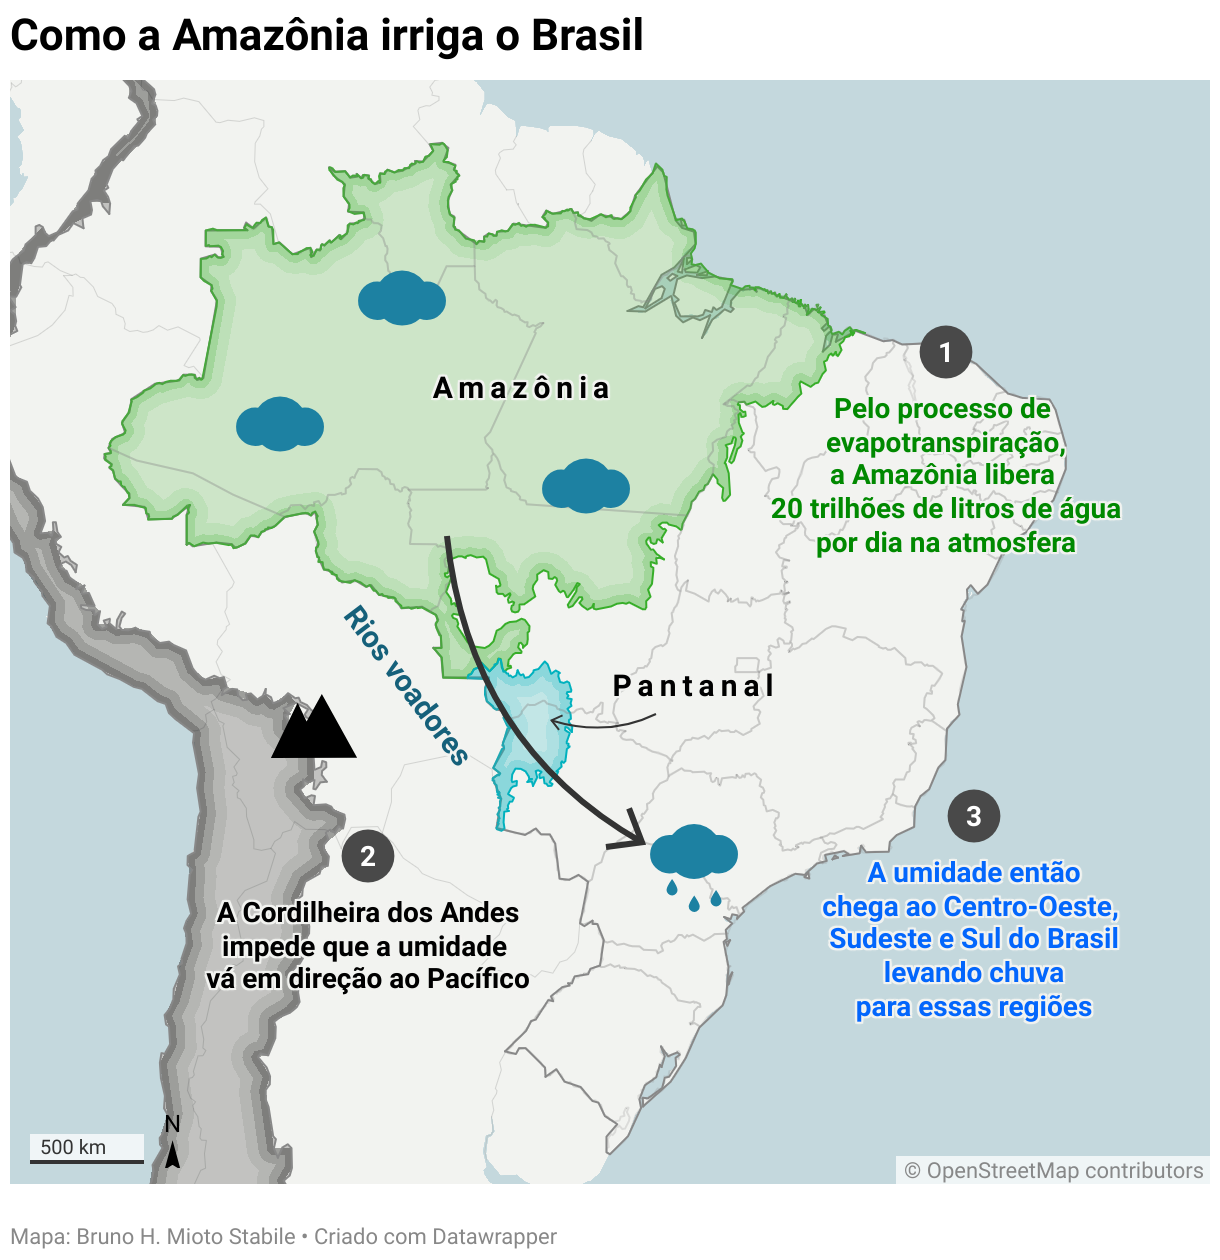
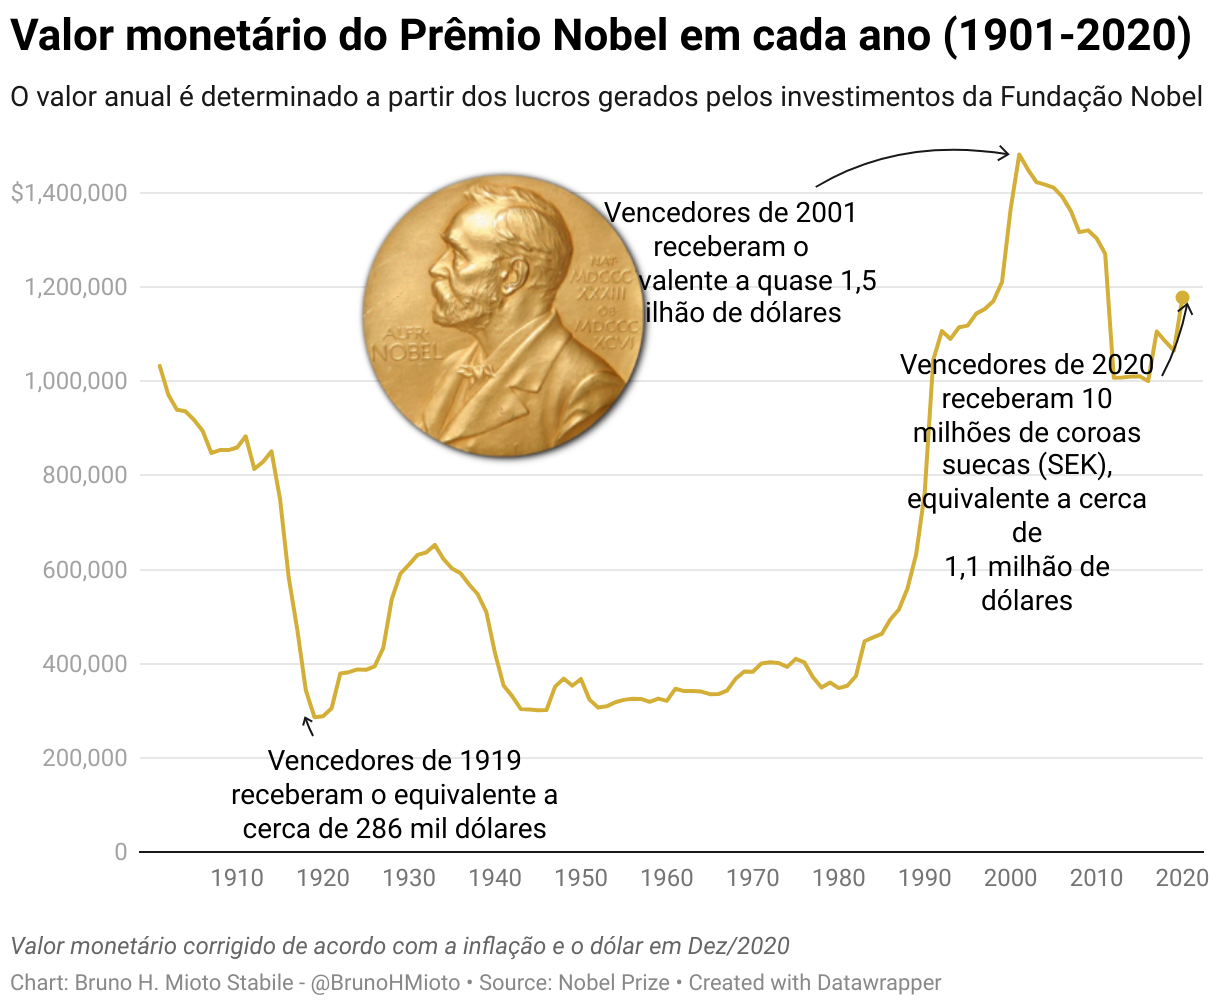
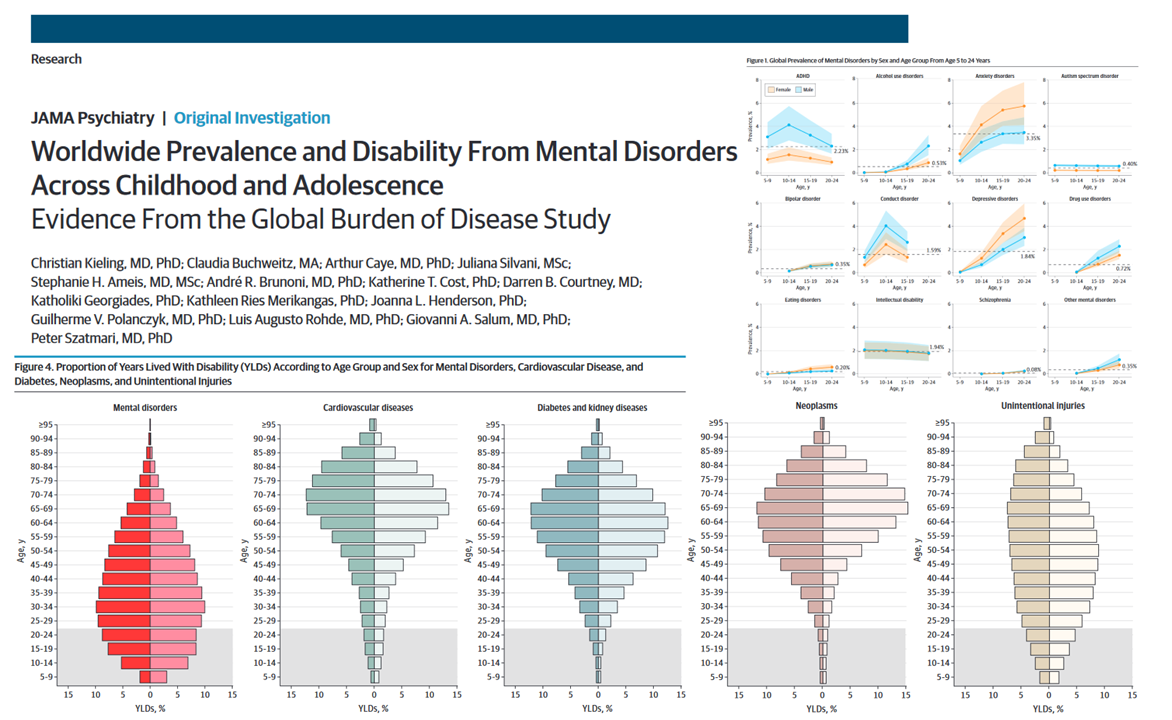
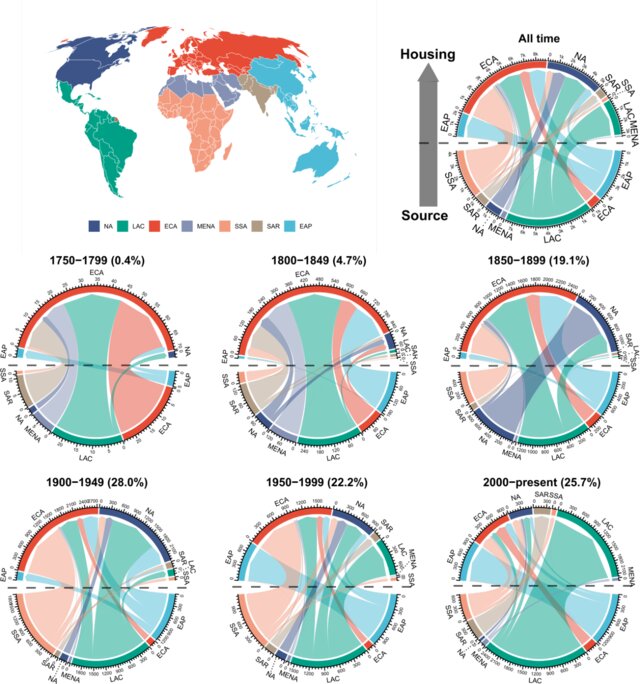
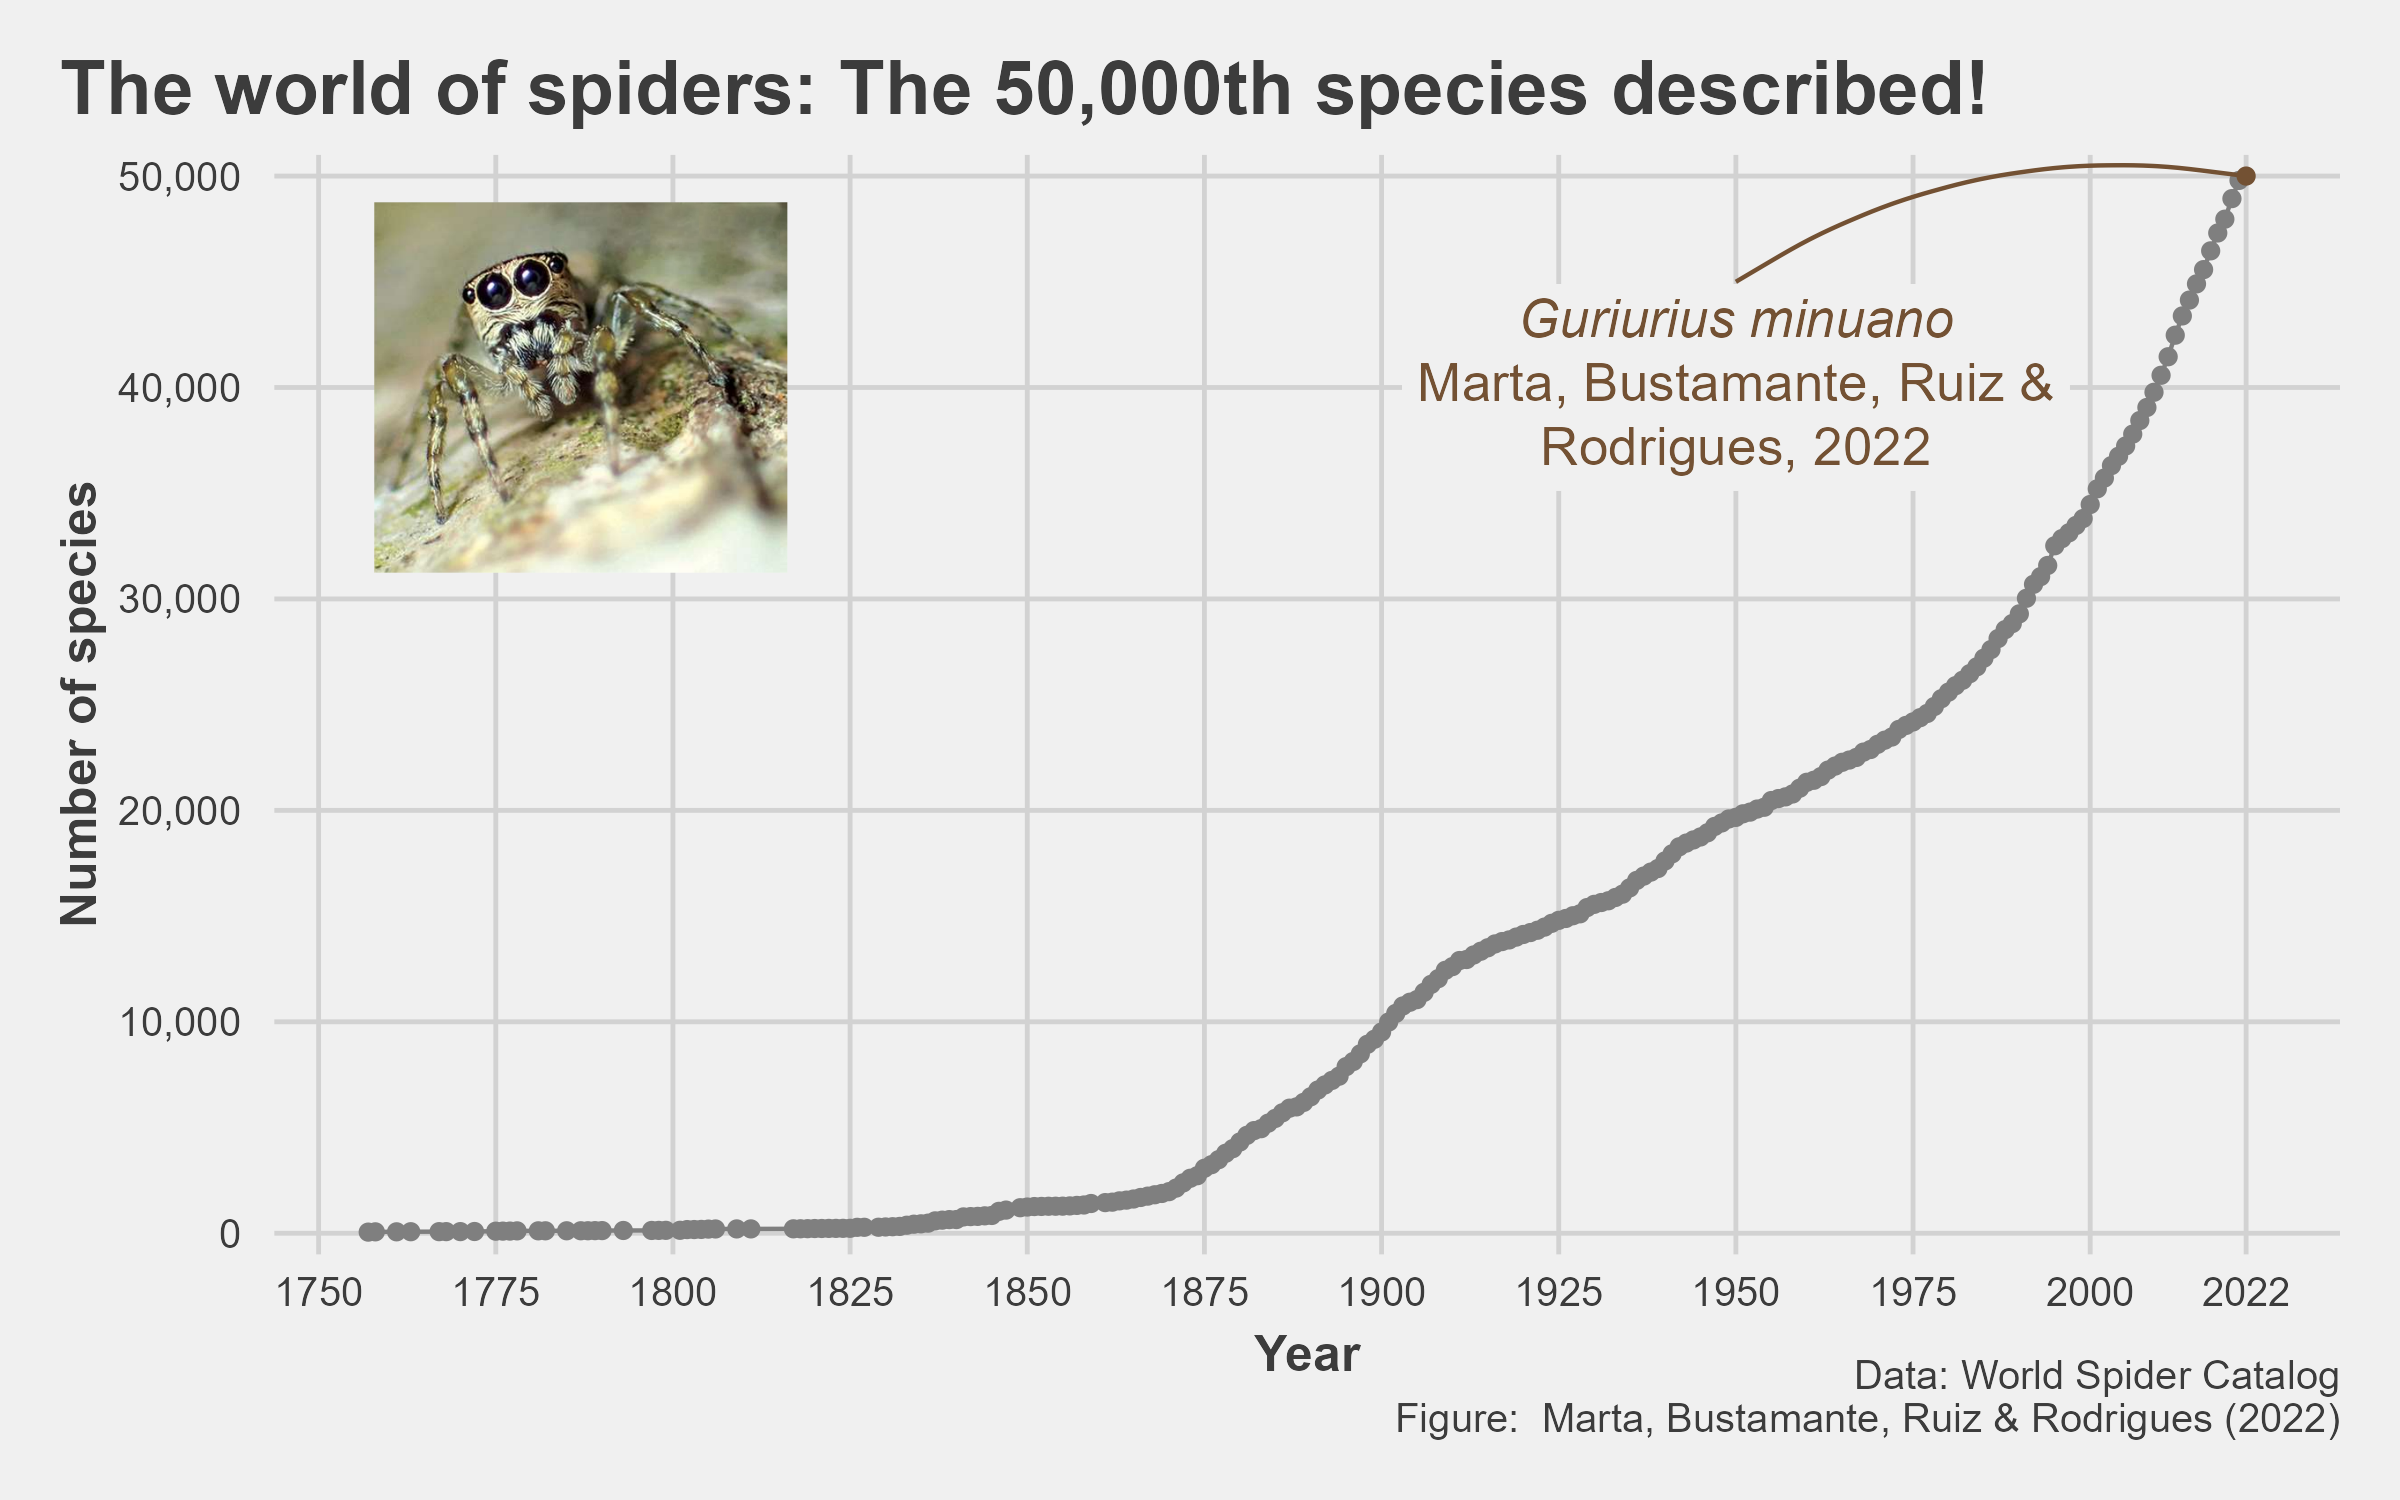
These are some charts published in scientific papers.
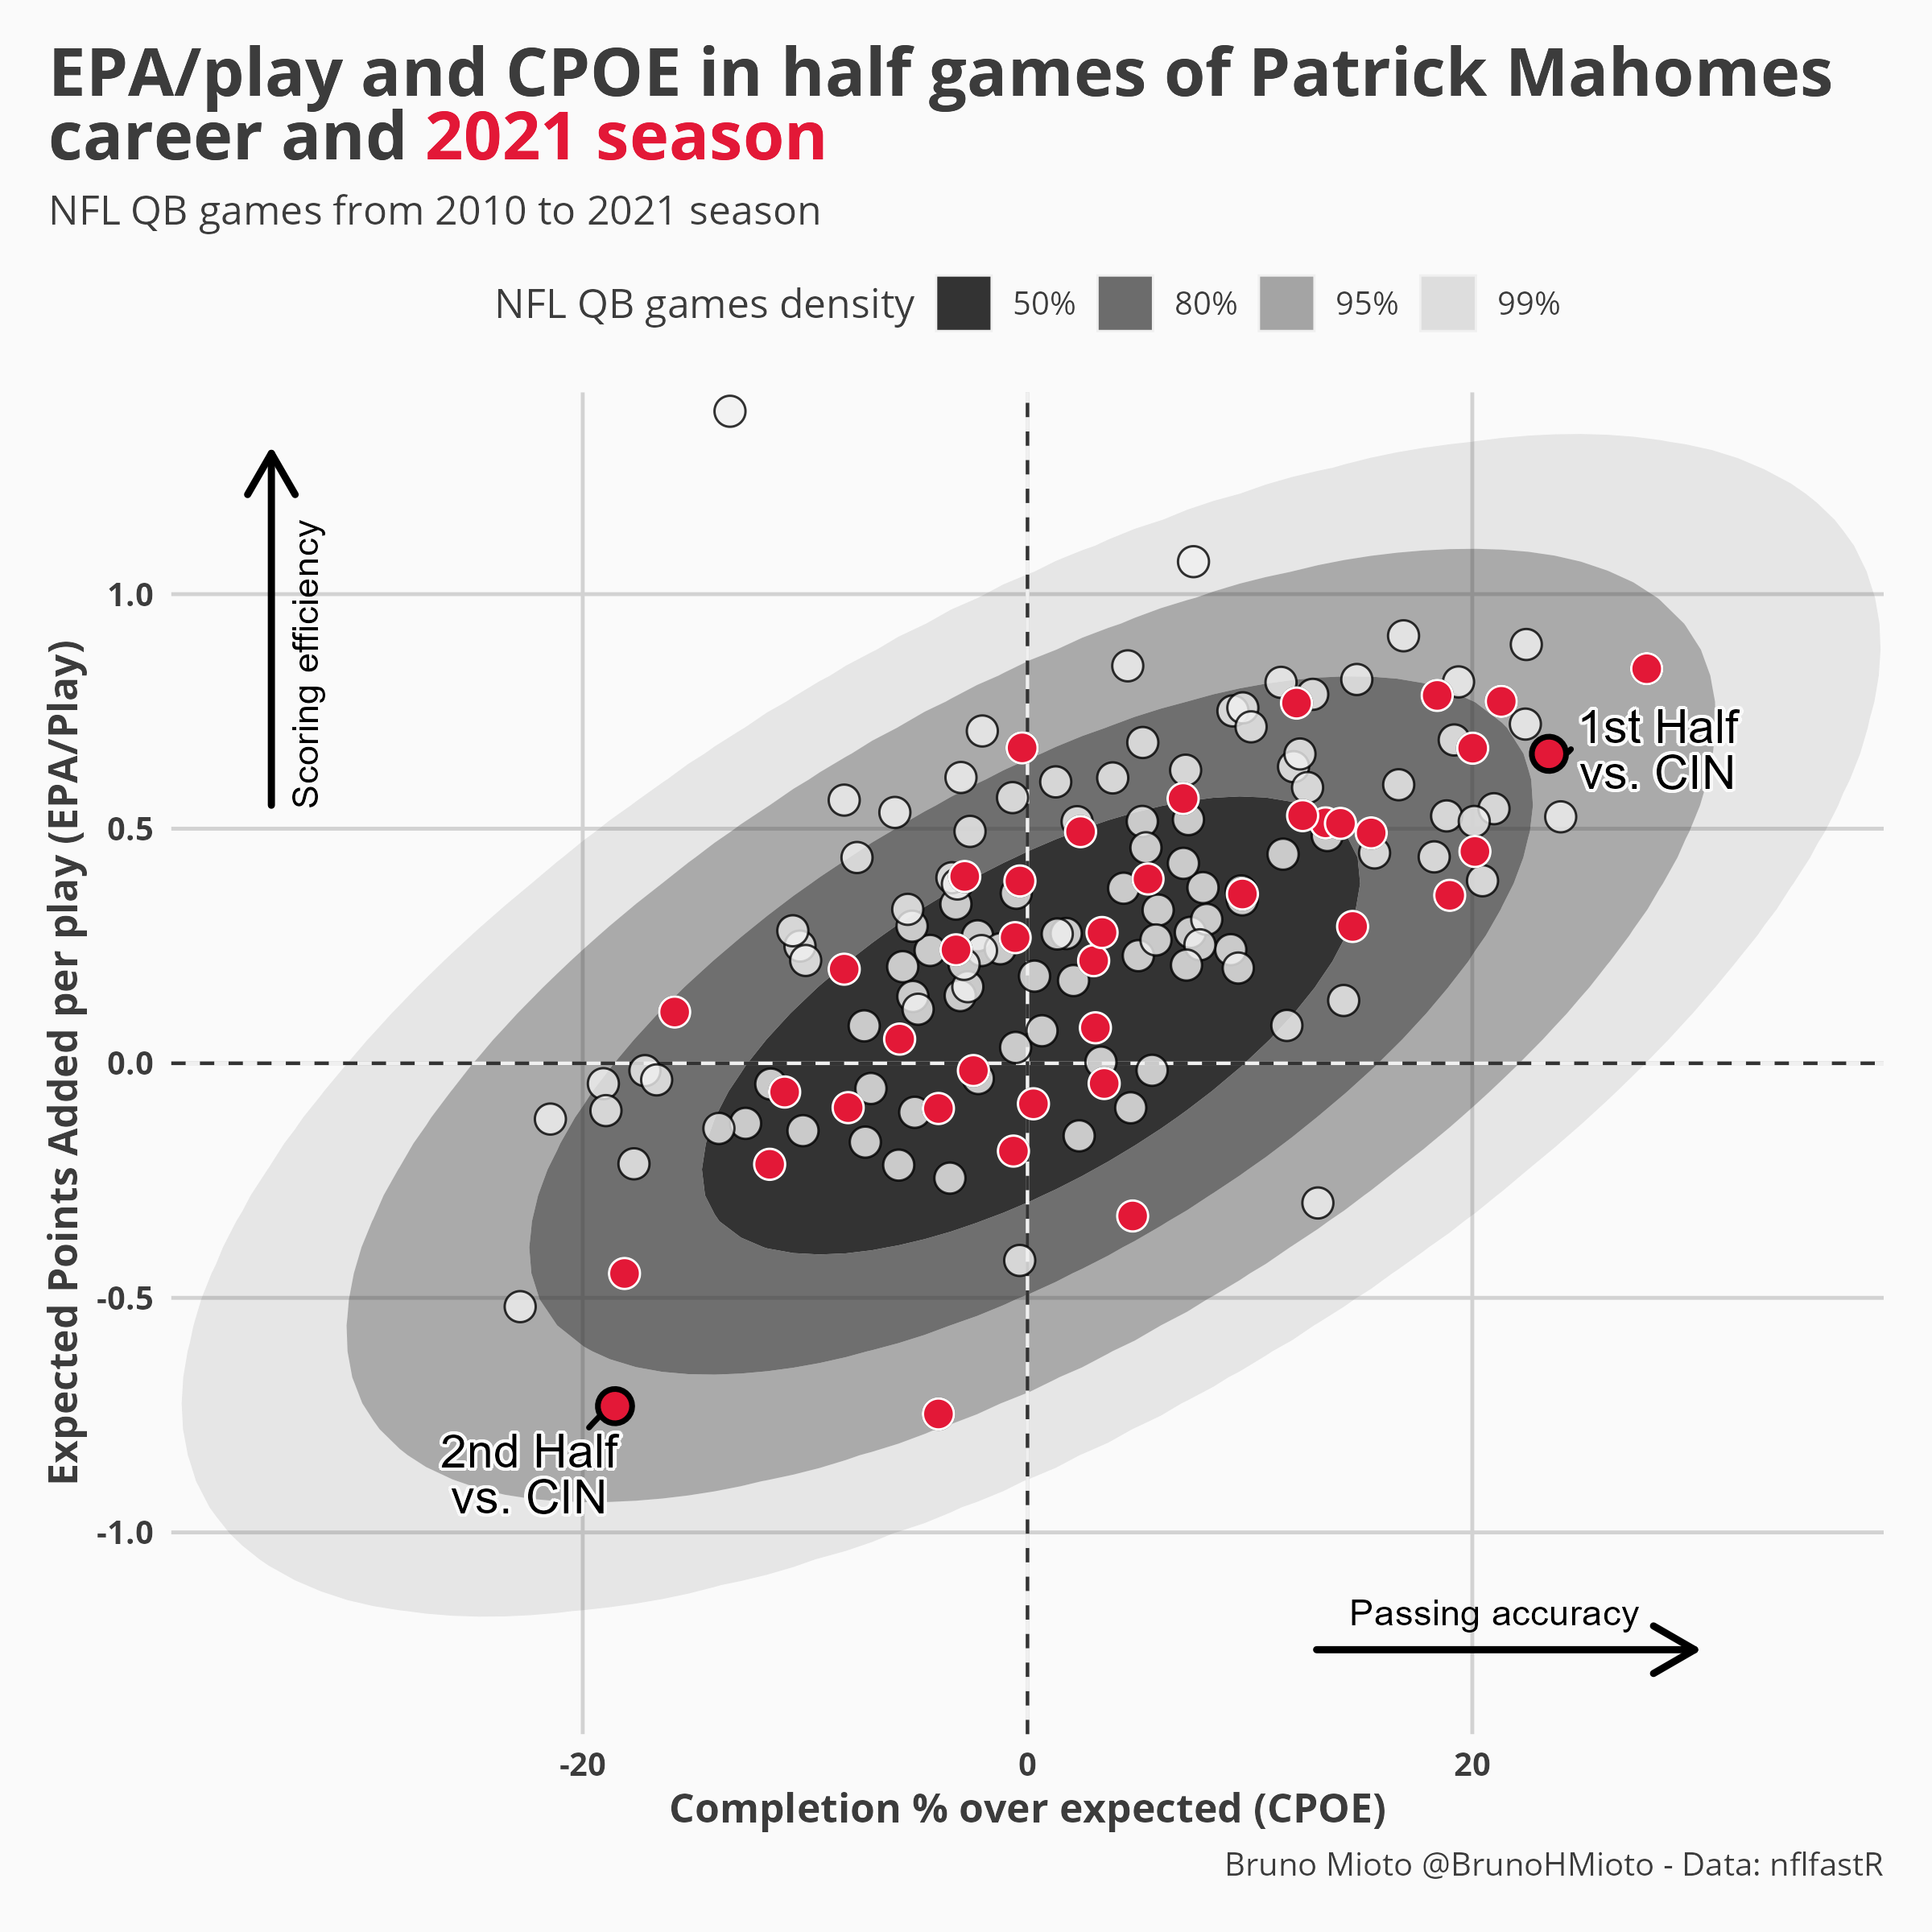
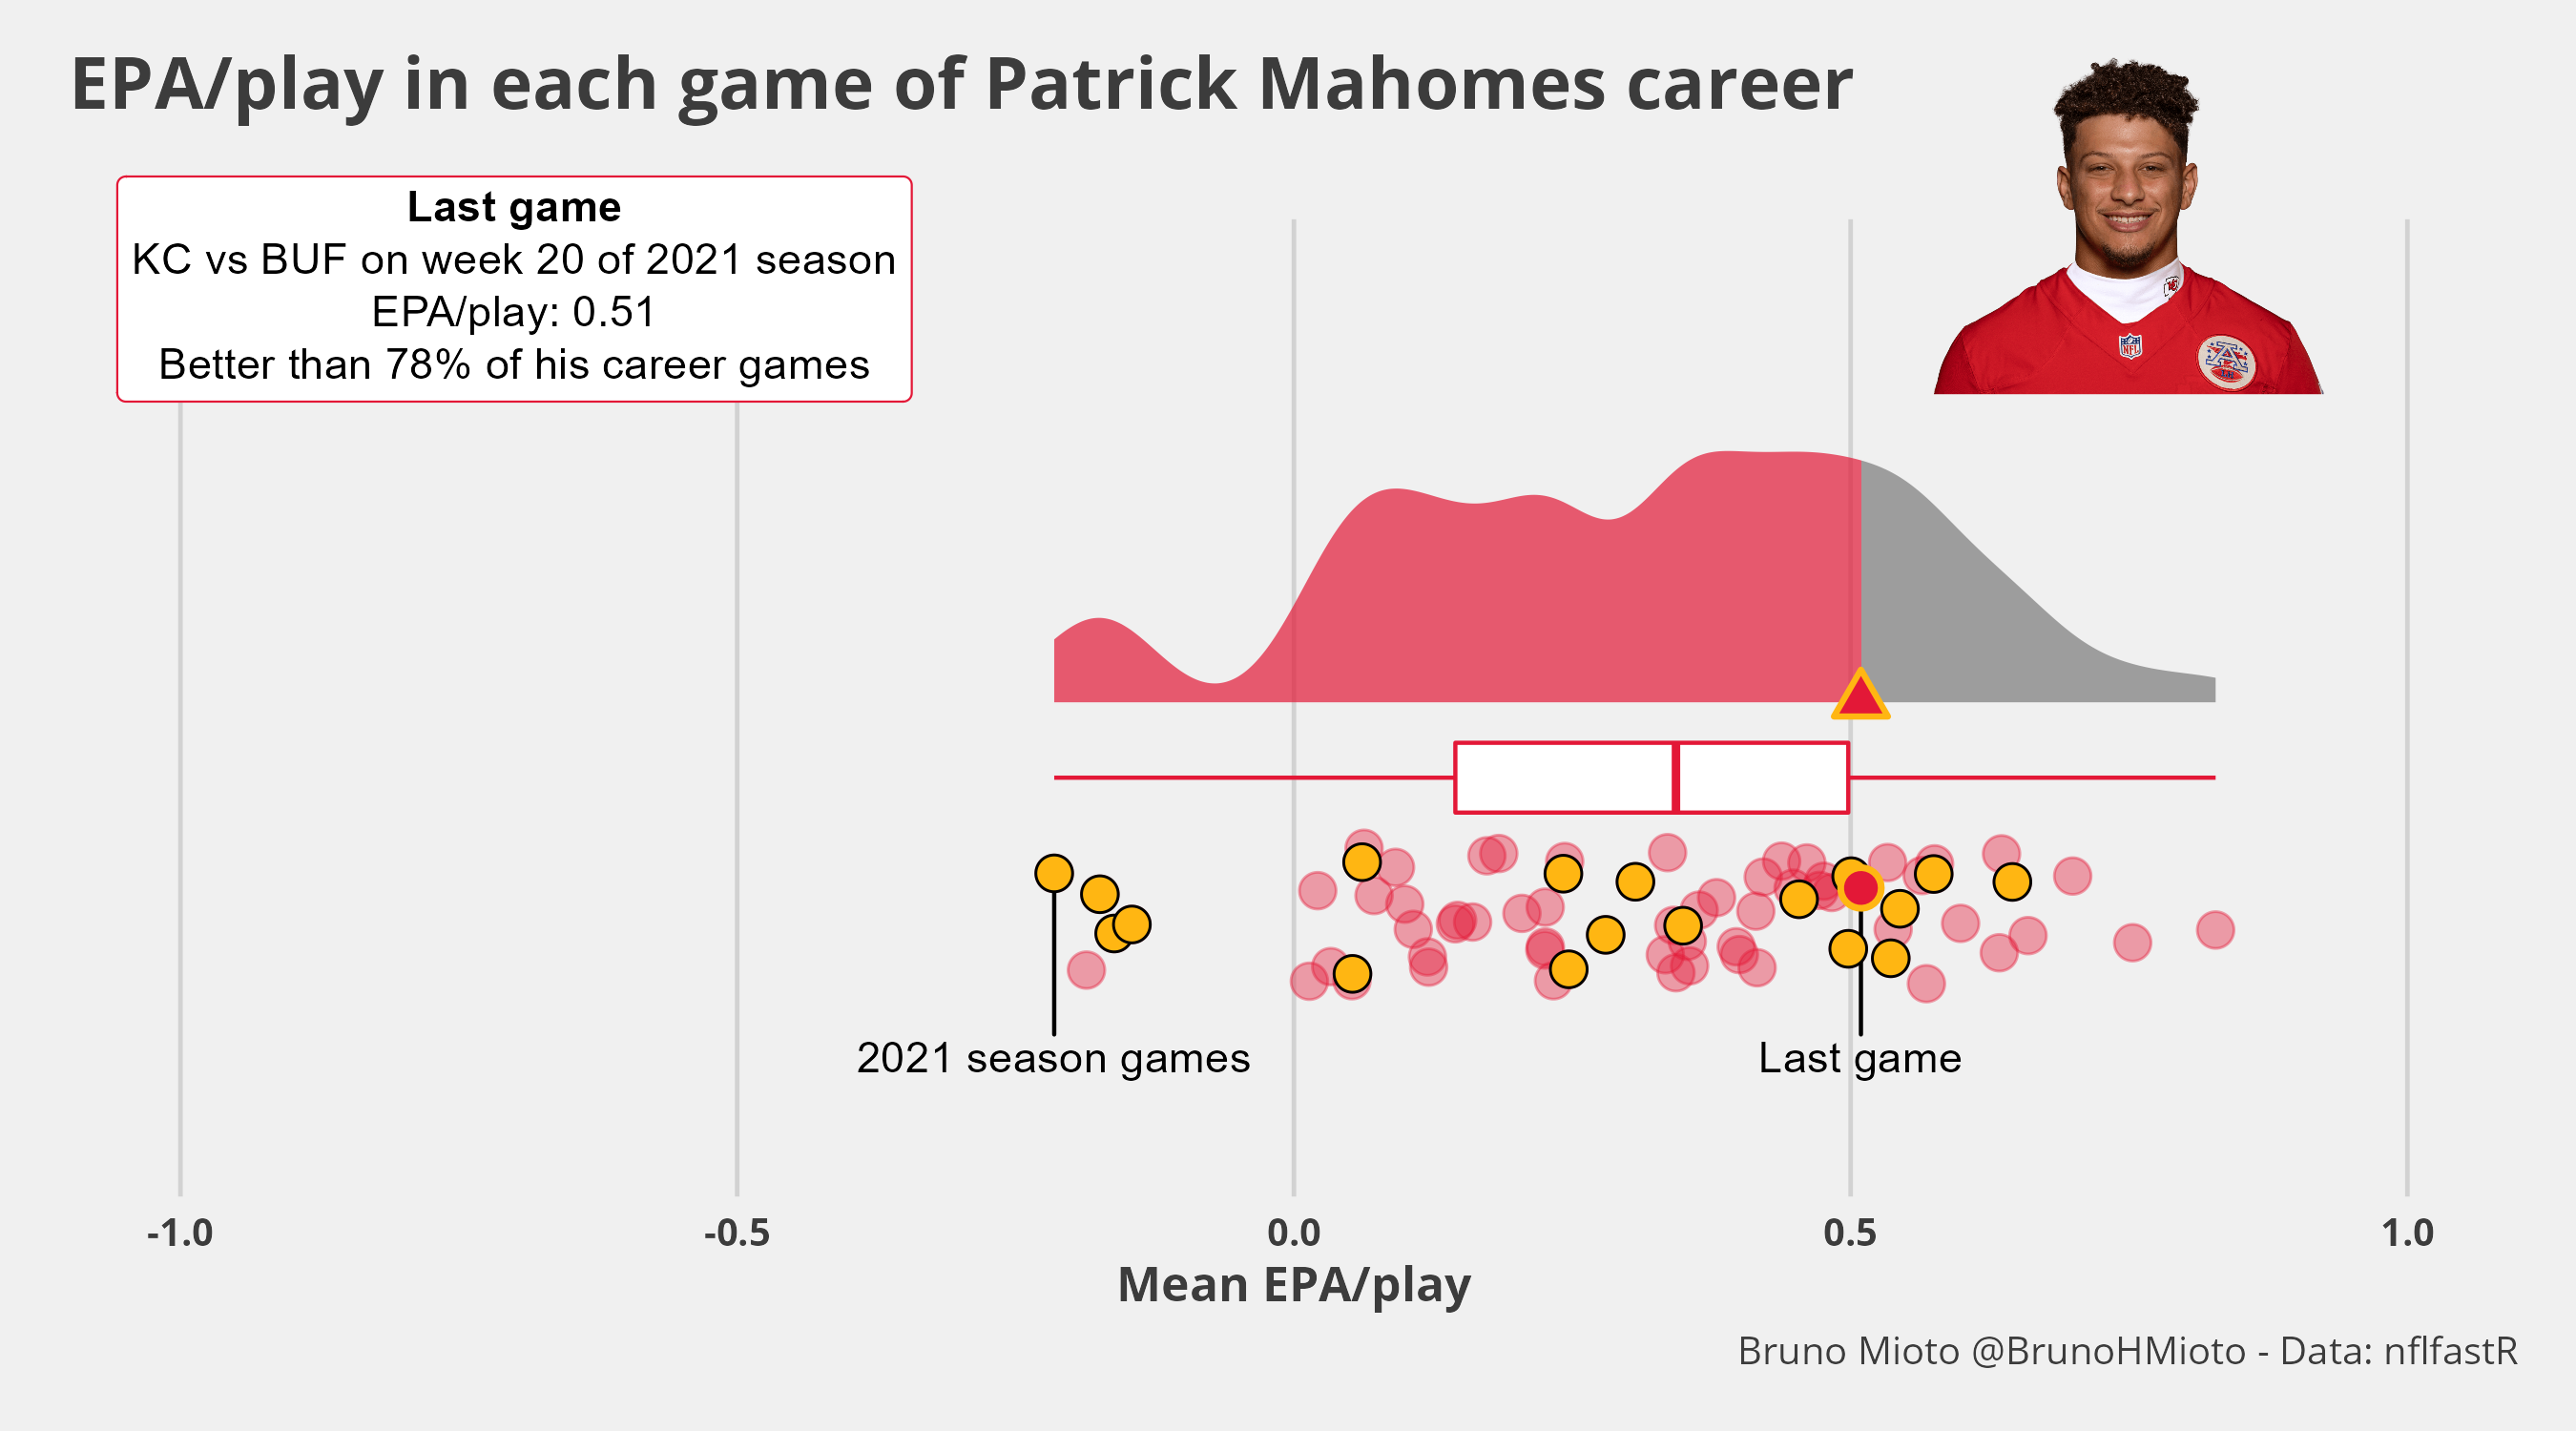
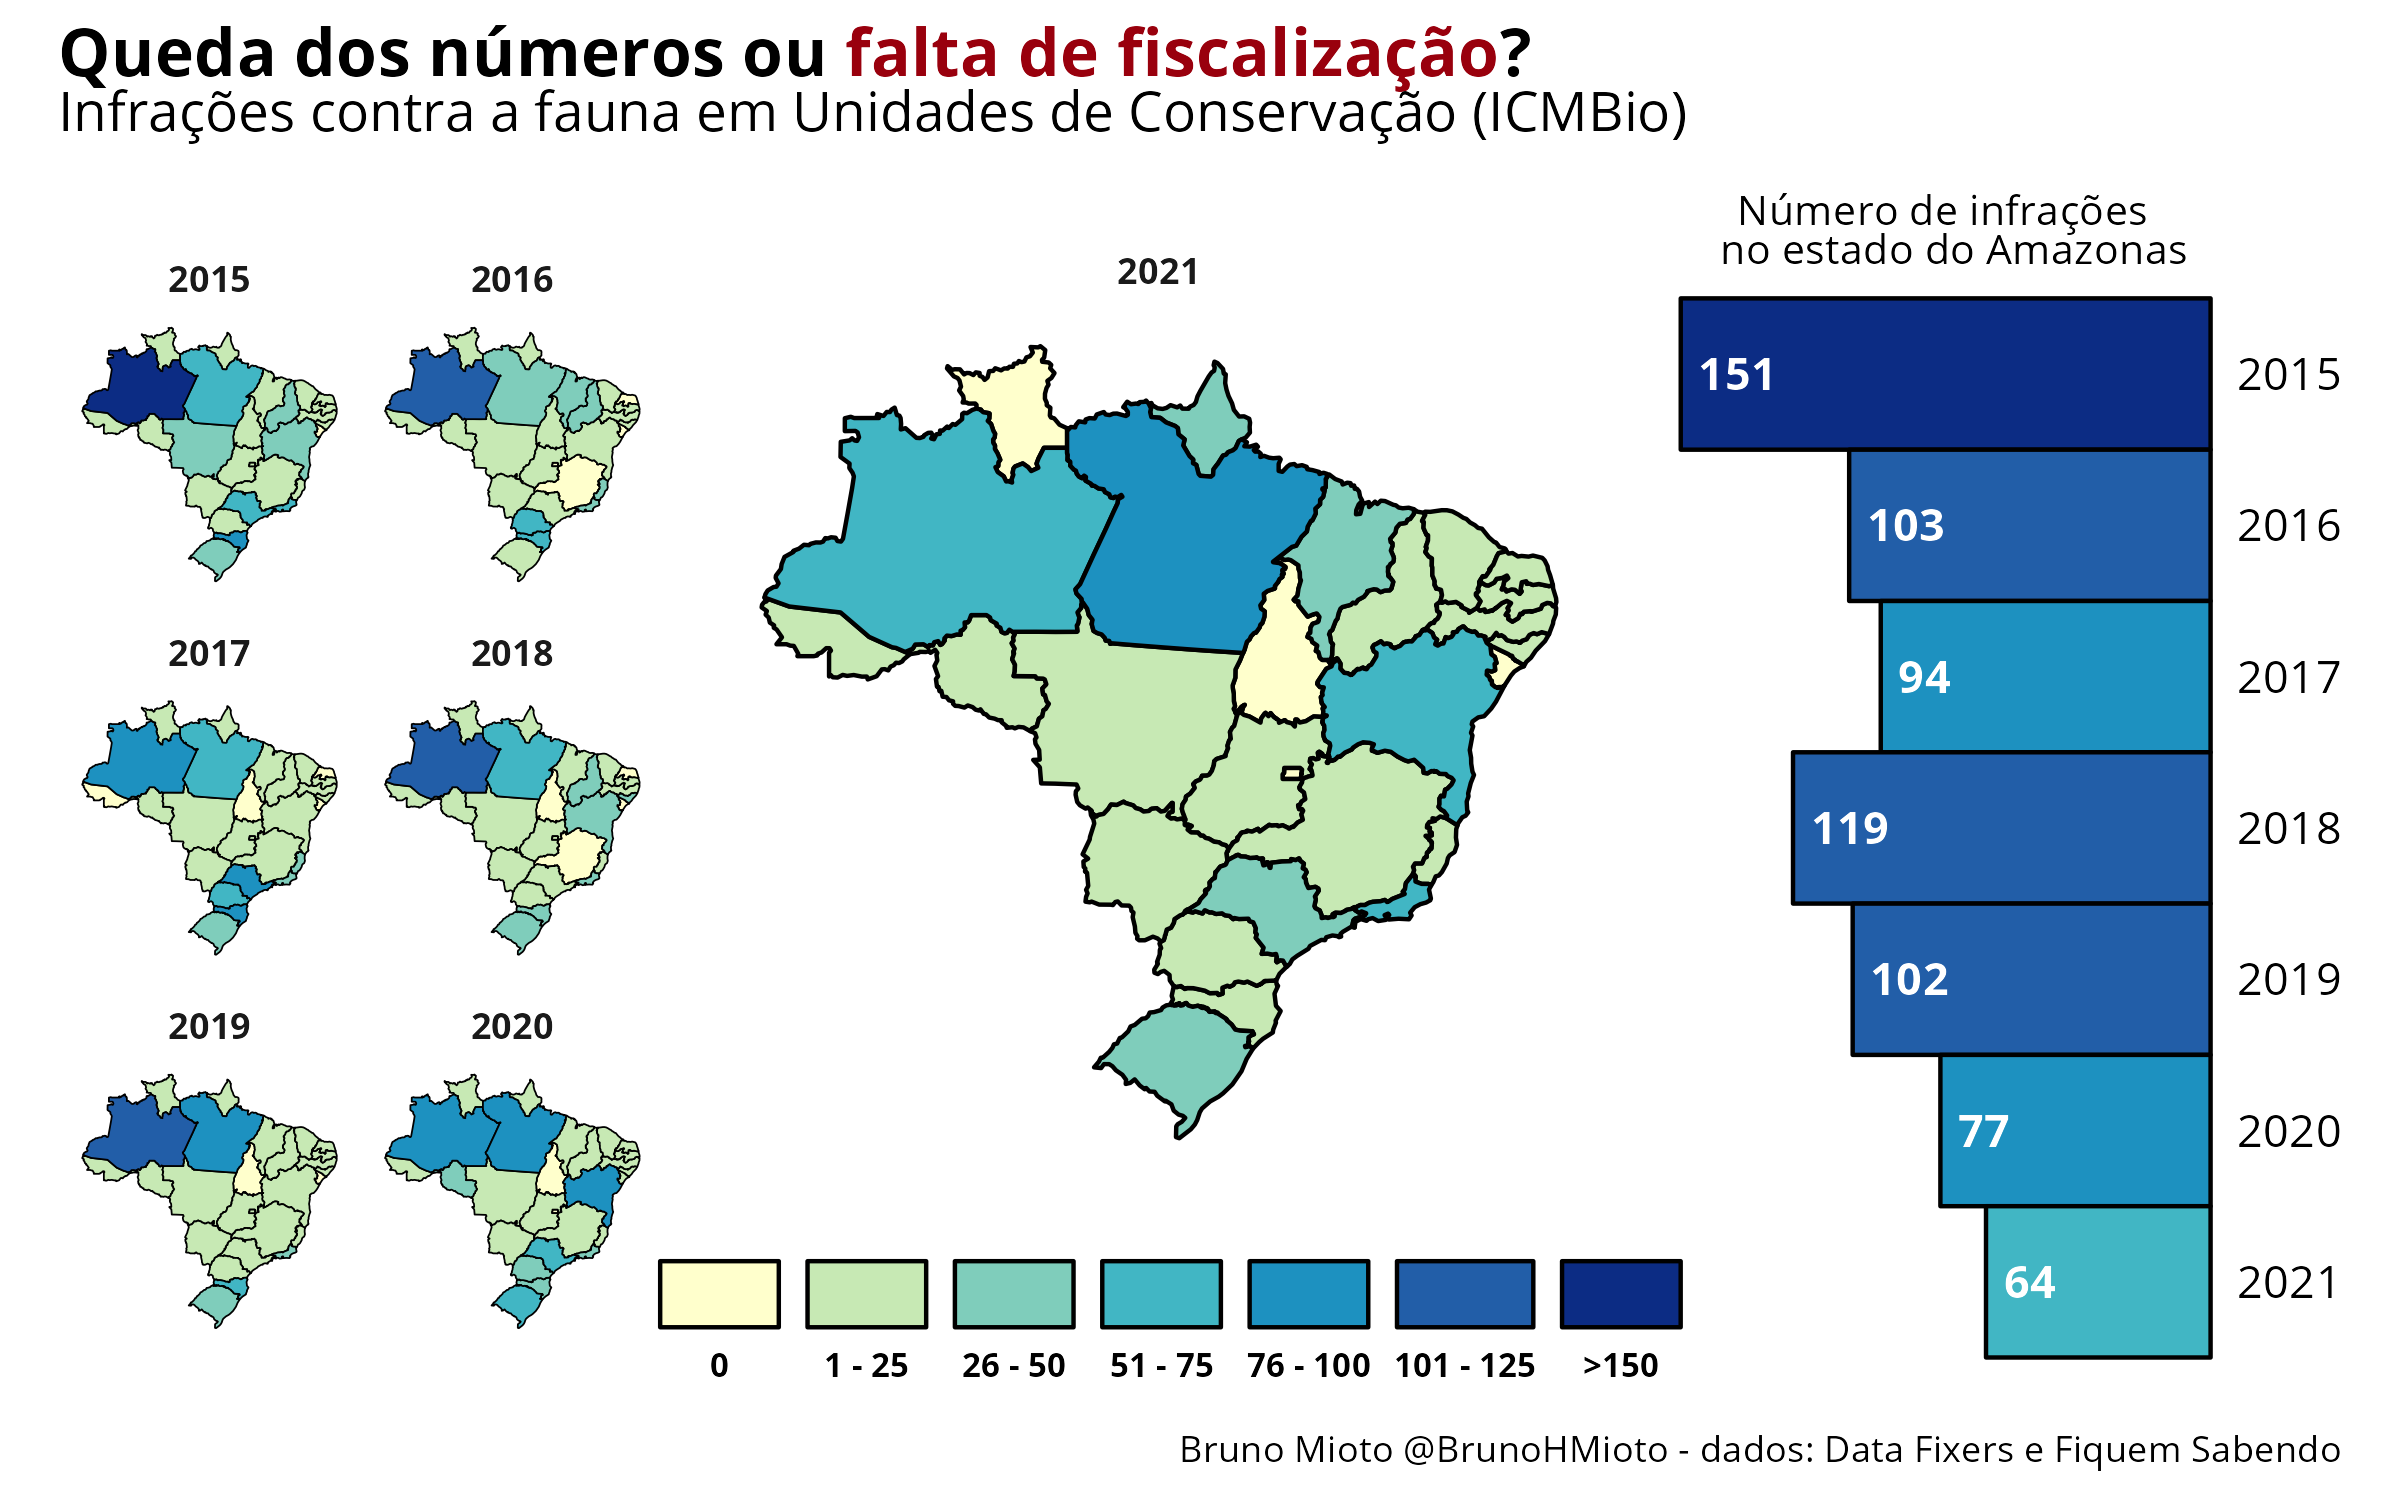
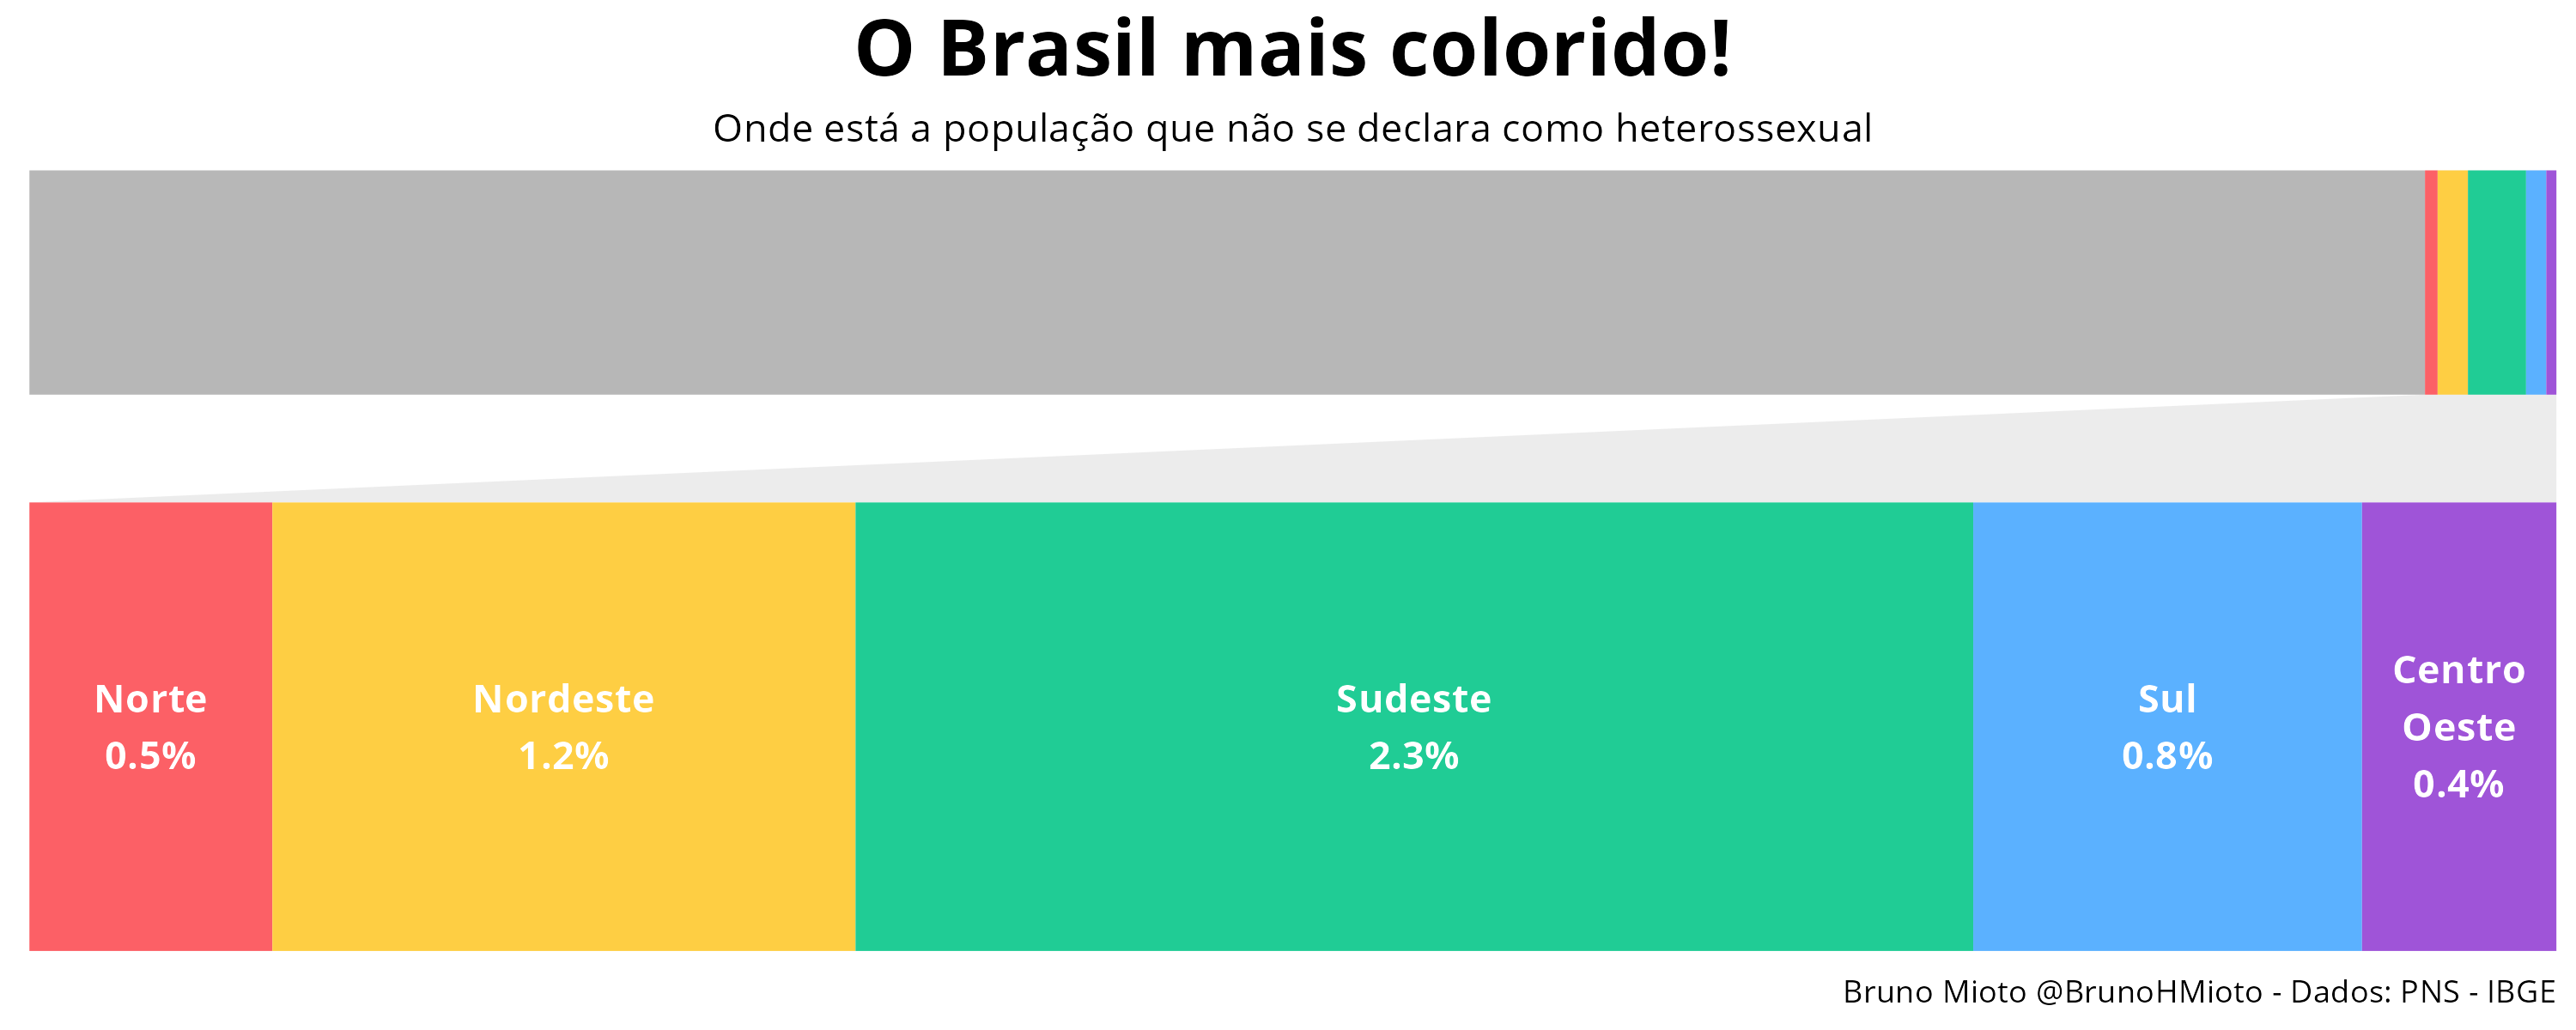
All the following charts and maps were made entirely using ggplot2/R. You can click on each plot to see each detail.
This is a play animation made for BigDataBowl ’24 Competition, the NFL Big Data competition!
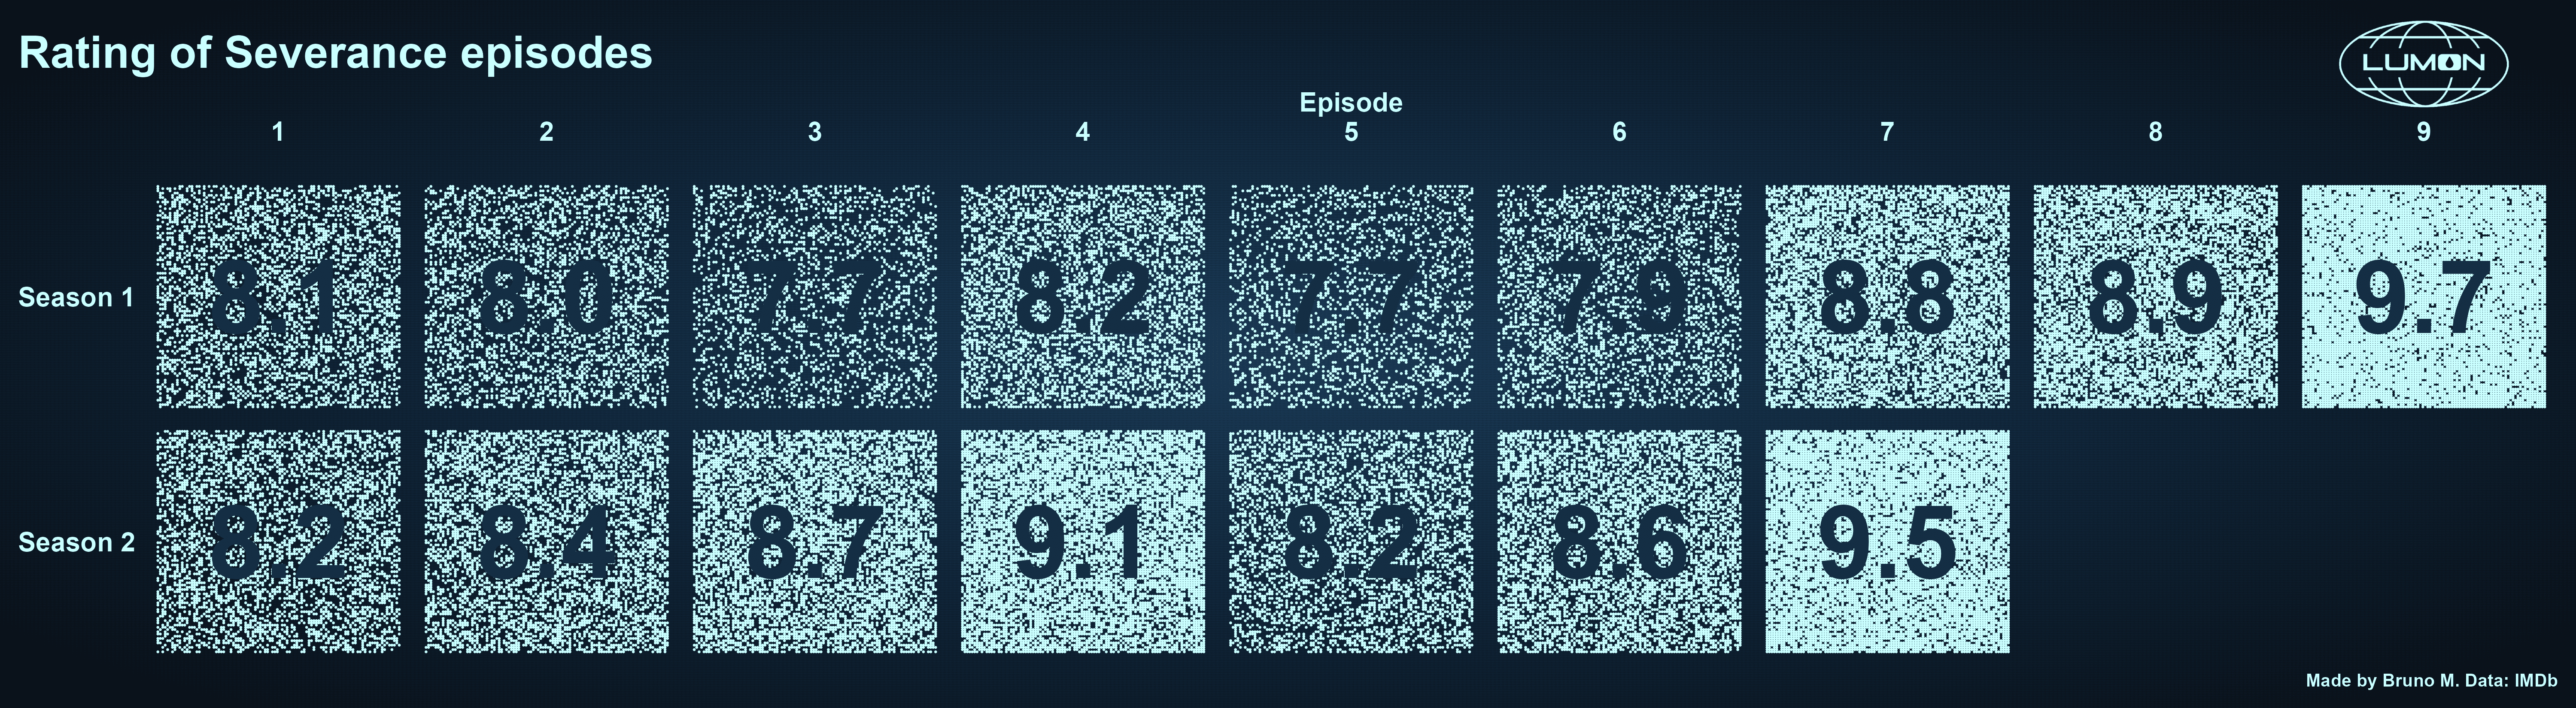
Severance is an awesome series
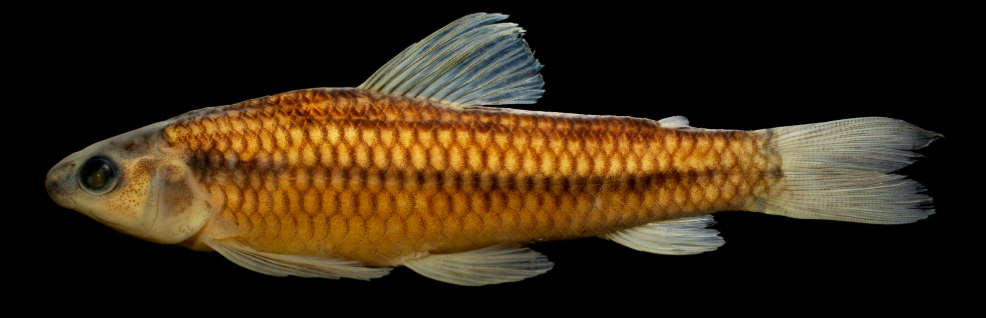
Species described! 🐟
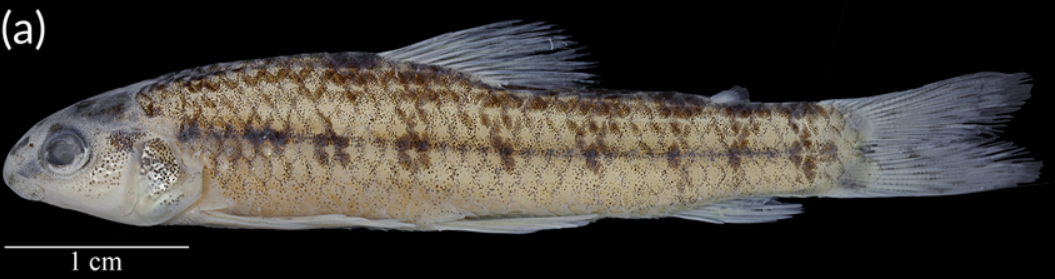
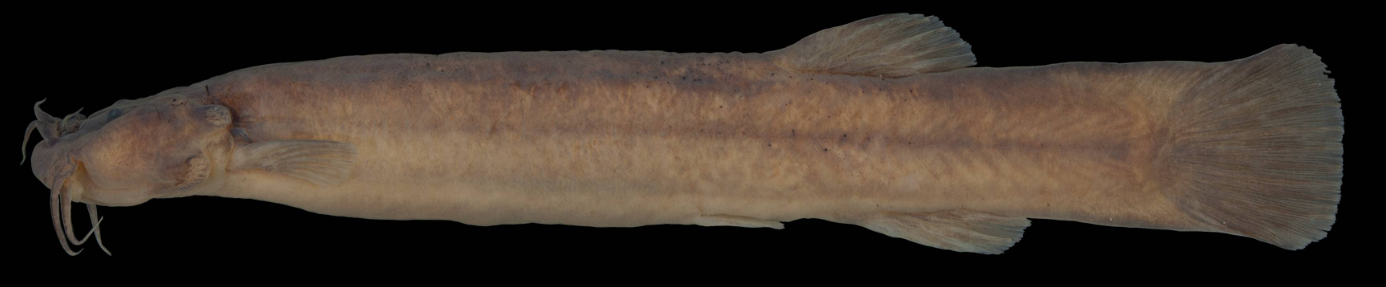
Even though it’s not data-related, I’m very proud to have described 3 species of fish (so far)! And yes, I’m “Stabile”, not “Mioto” in my scientific papers
Characidium dumonti Stabile, dos Reis, de Oliveira & da Graça 2025
Characidium itarare Stabile, dos Reis, Frota, da Graça & de Oliveira 2024
Cambeva perobana Martins, dos Reis, Stabile & da Graça 2024