Bruno Mioto
  • Home
  • Charts
  • R
    • R packages
    • Scripts
    • Twitter bots
  • About me

On this page

  • Collaborations
  • Published charts
  • Original charts

Charts

I make original charts on demand for presentations/scientific articles/publications

I work as a freelancer here: Upwork (Top Rated Freelancer)

My contact email address is bhmstabile@gmail.com

Want to support my work? 🥧 Buy me a Pie chart

Collaborations

Published charts

These are some charts published in scientific papers.
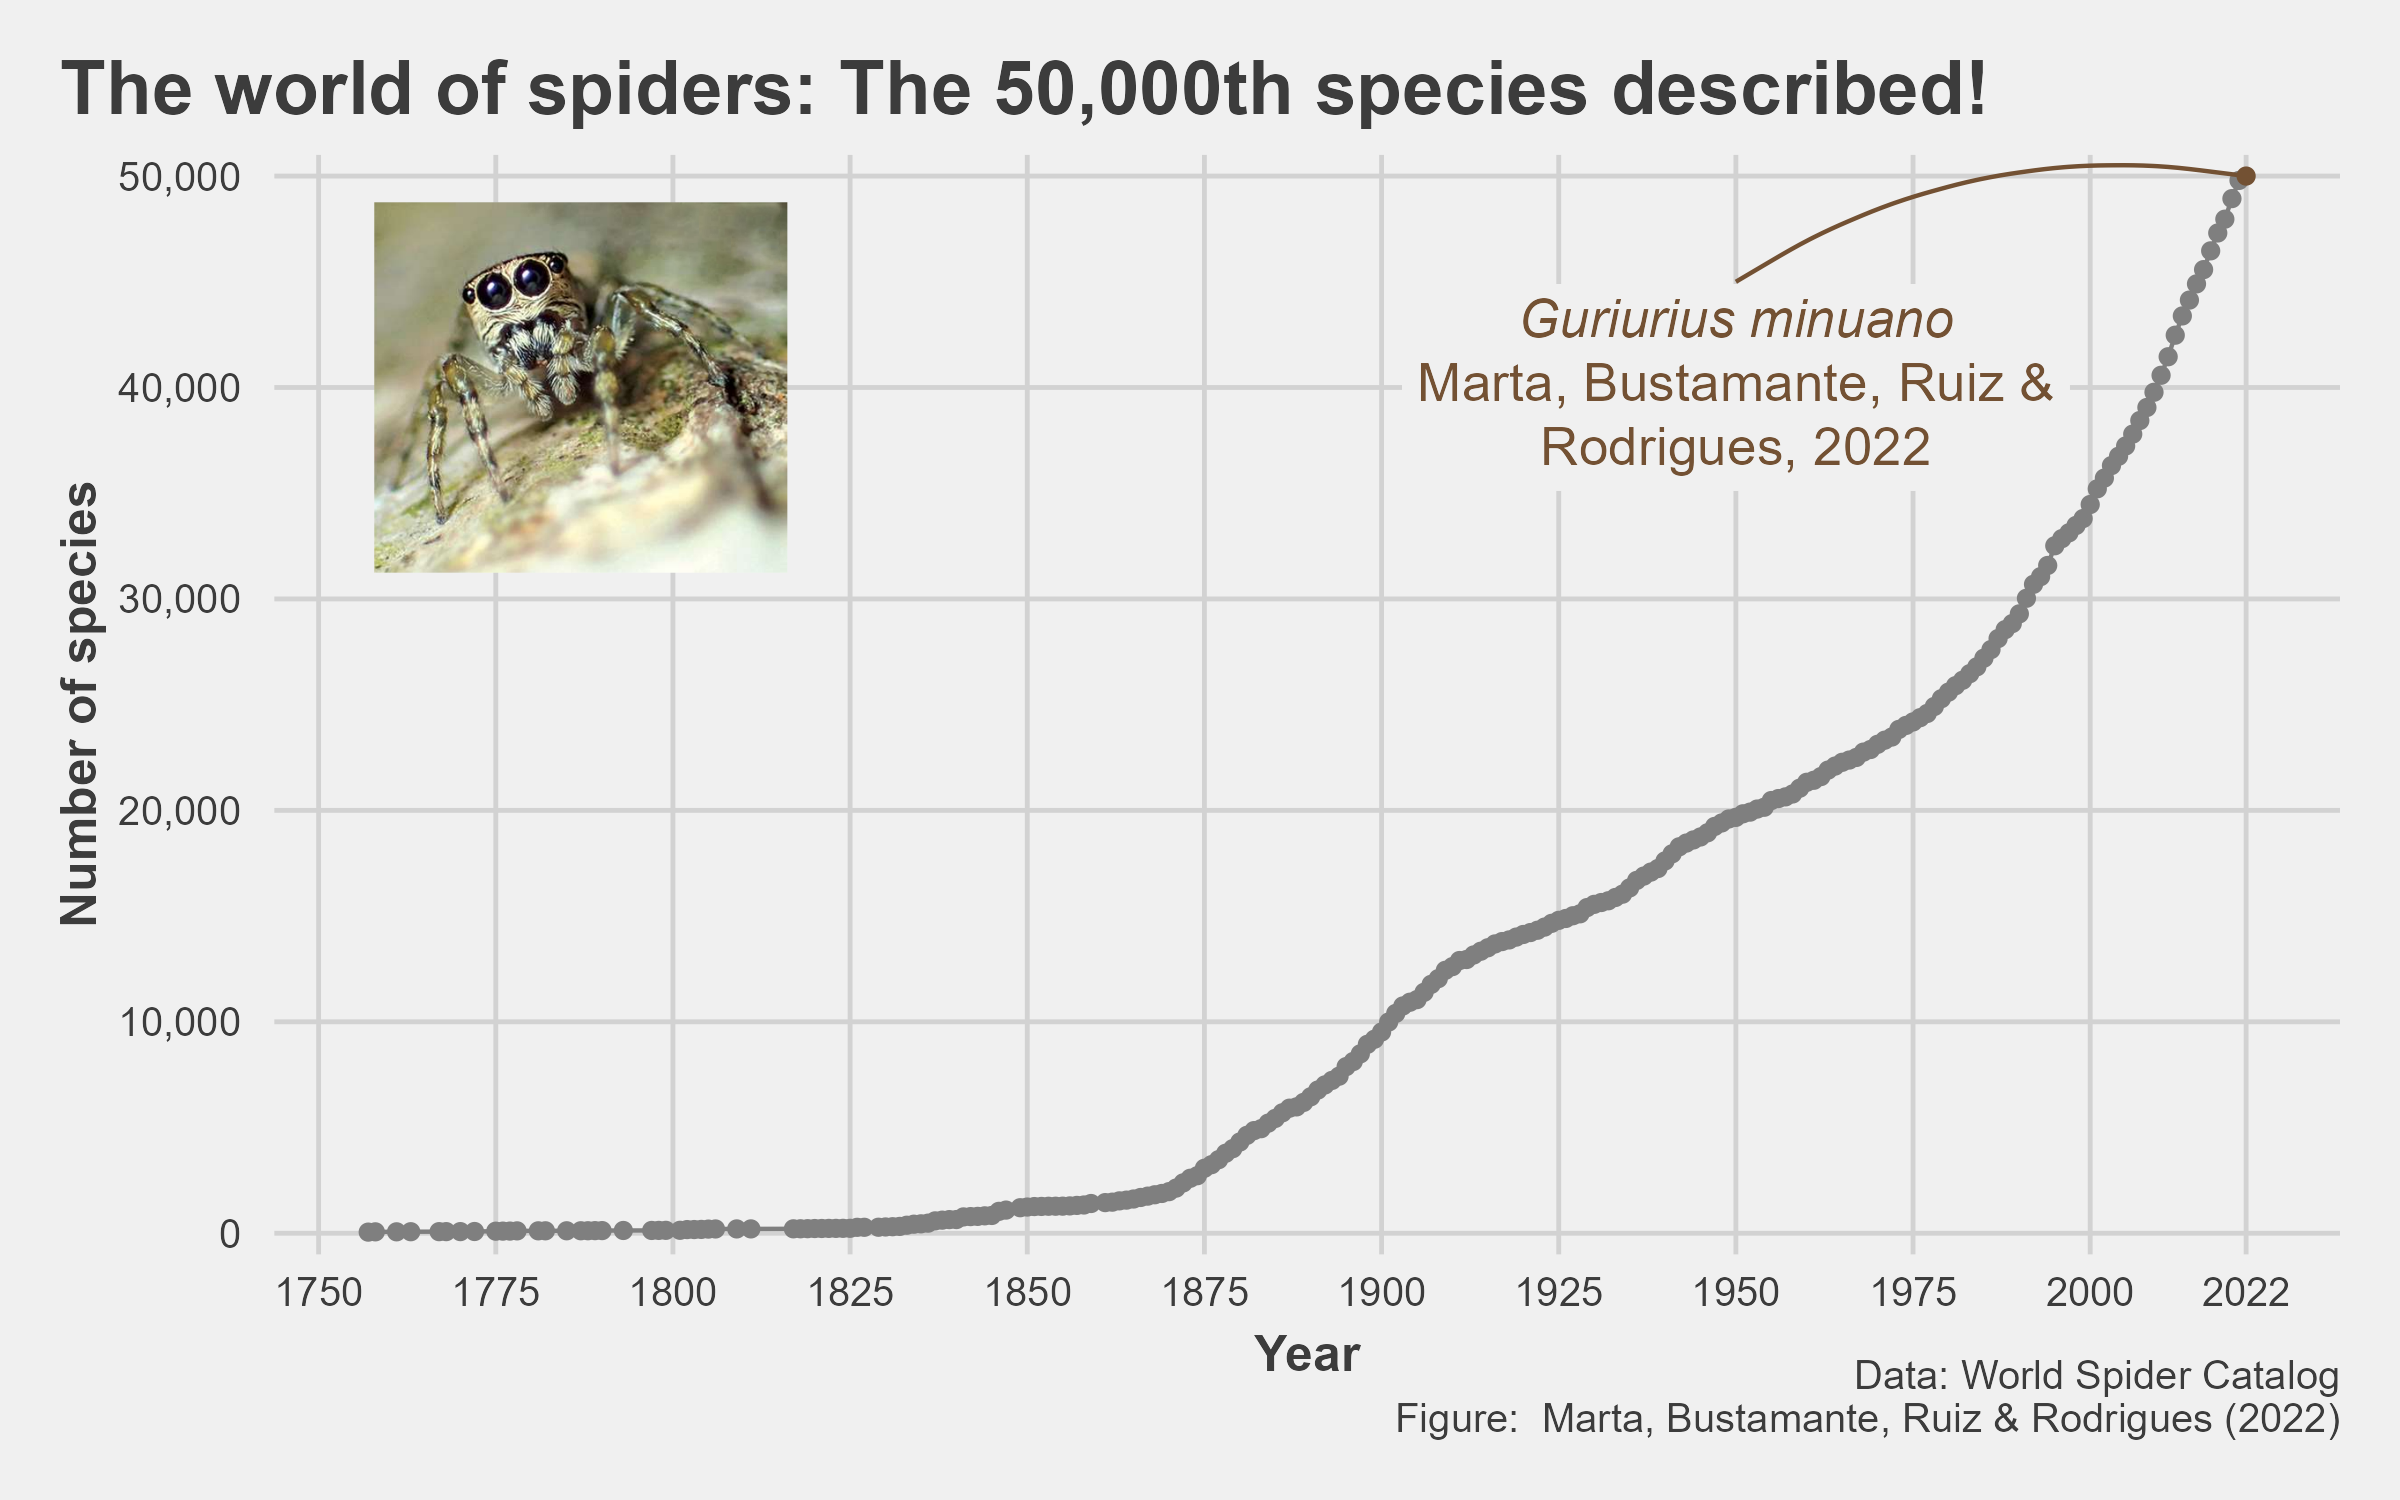
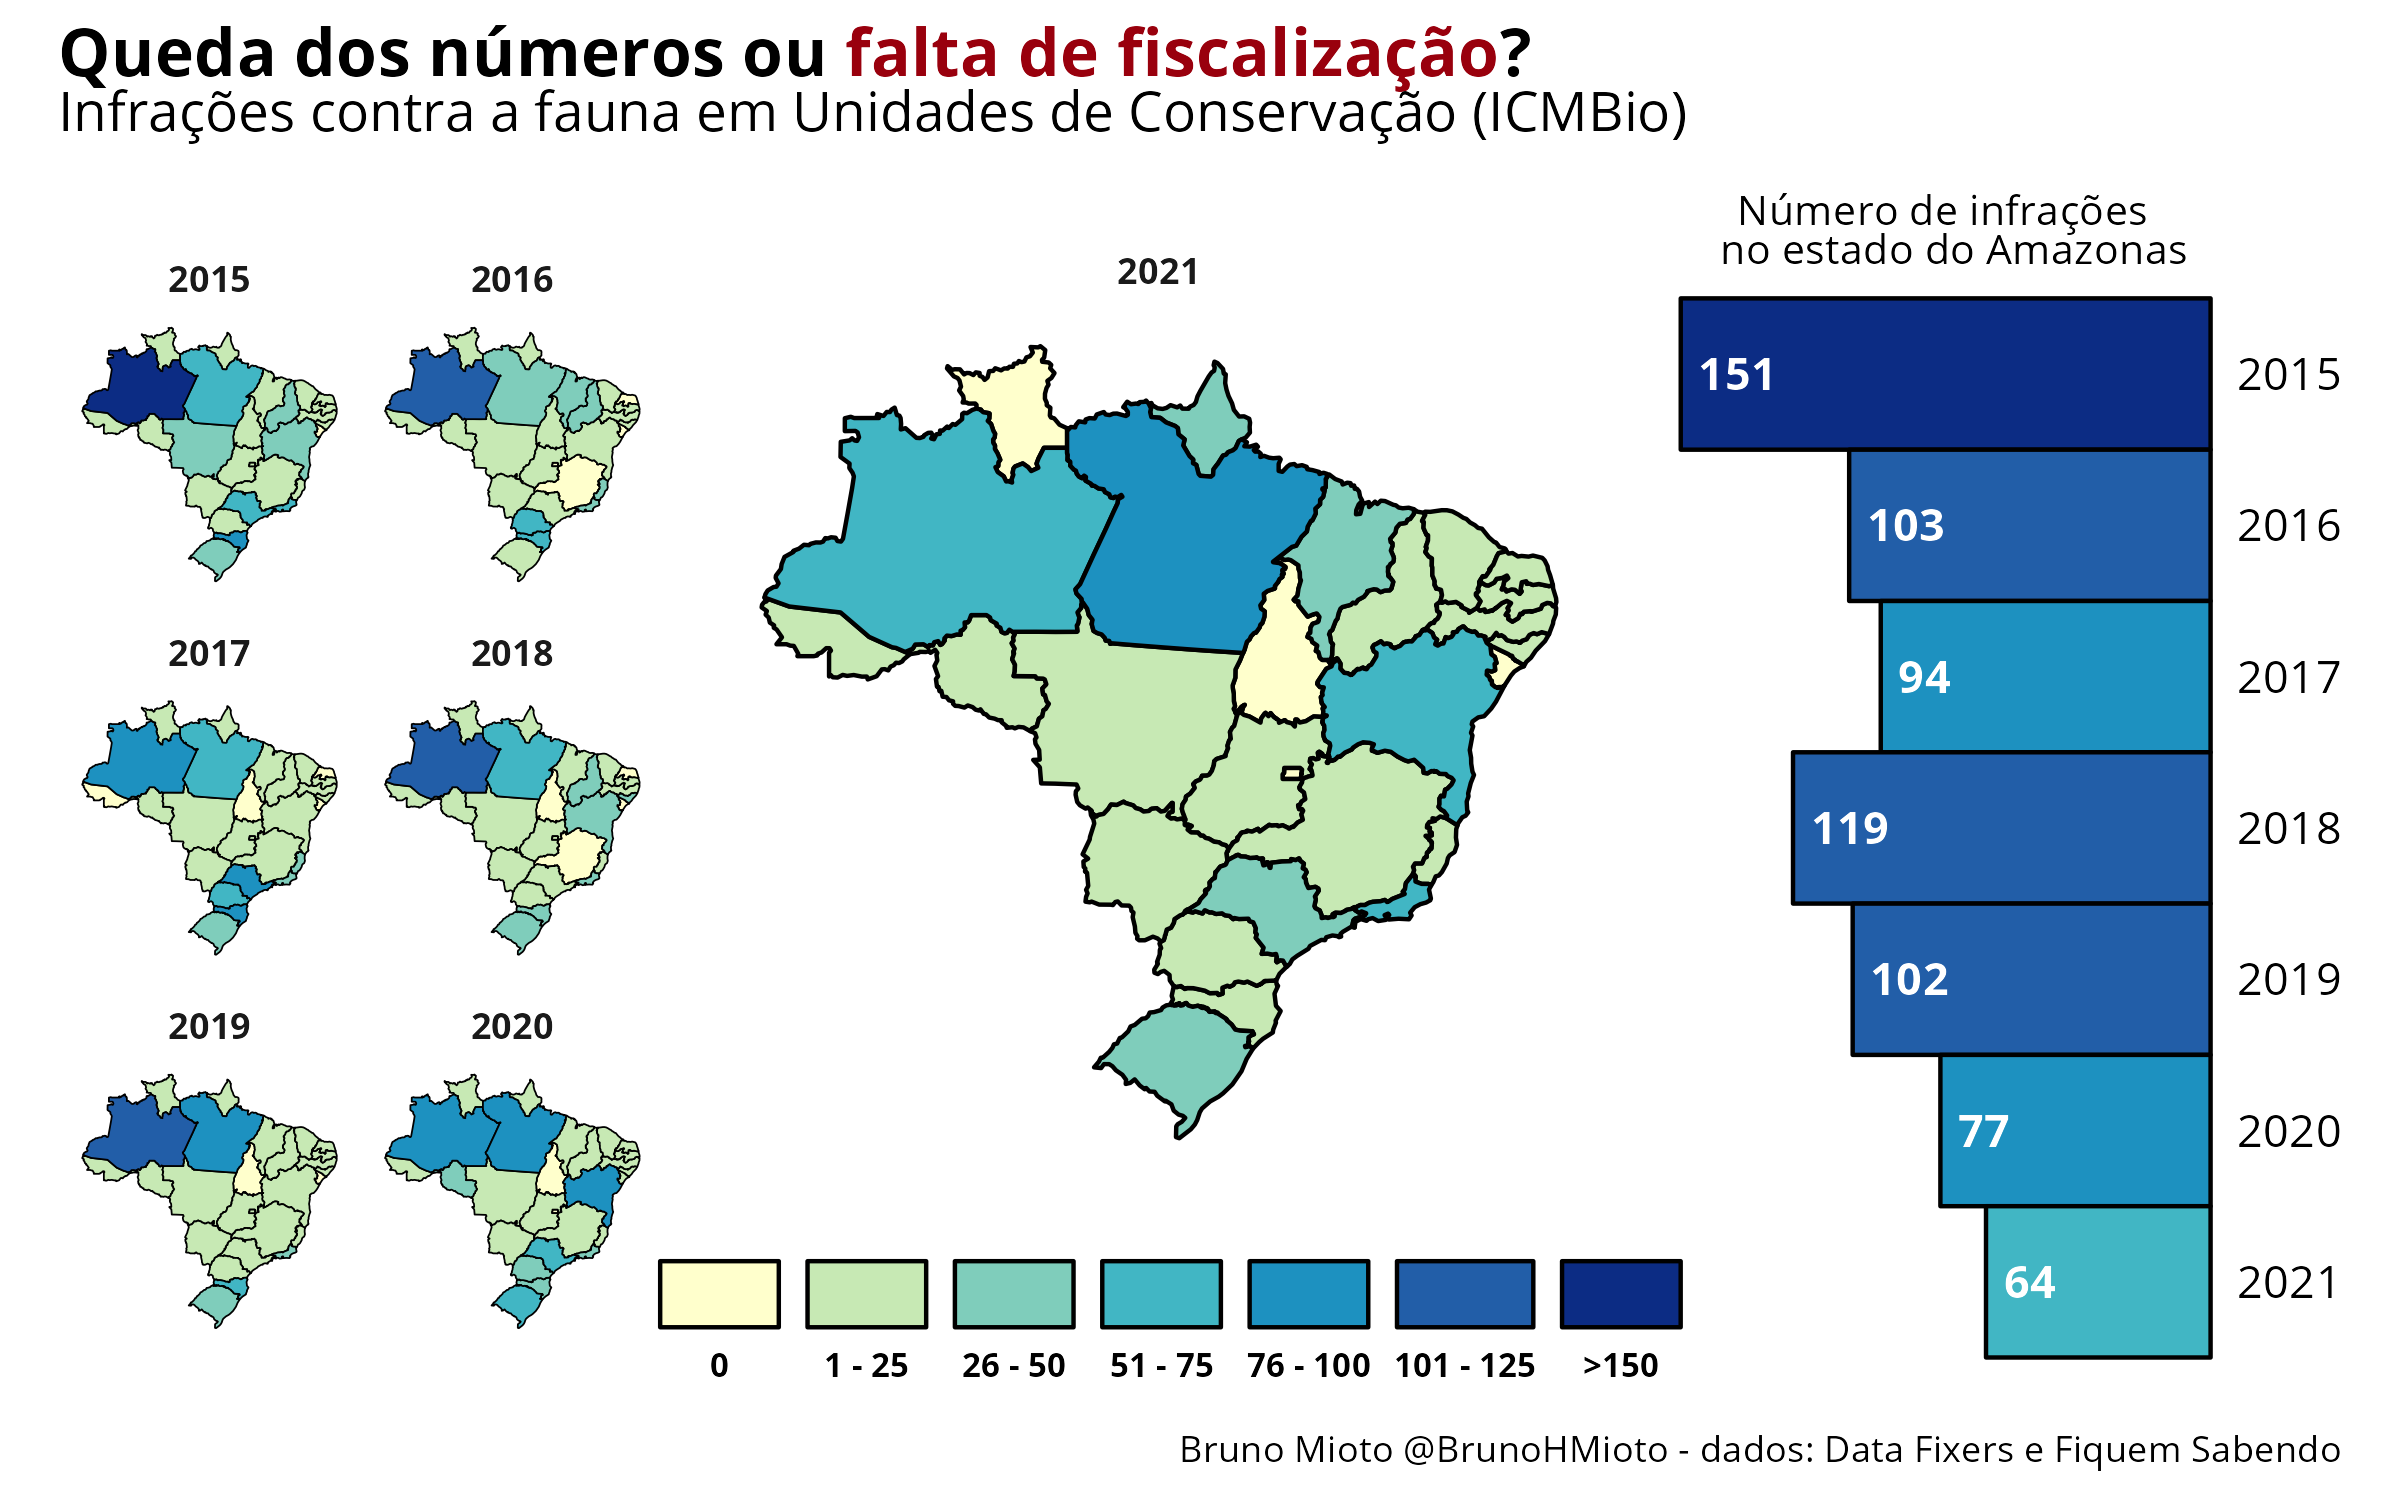
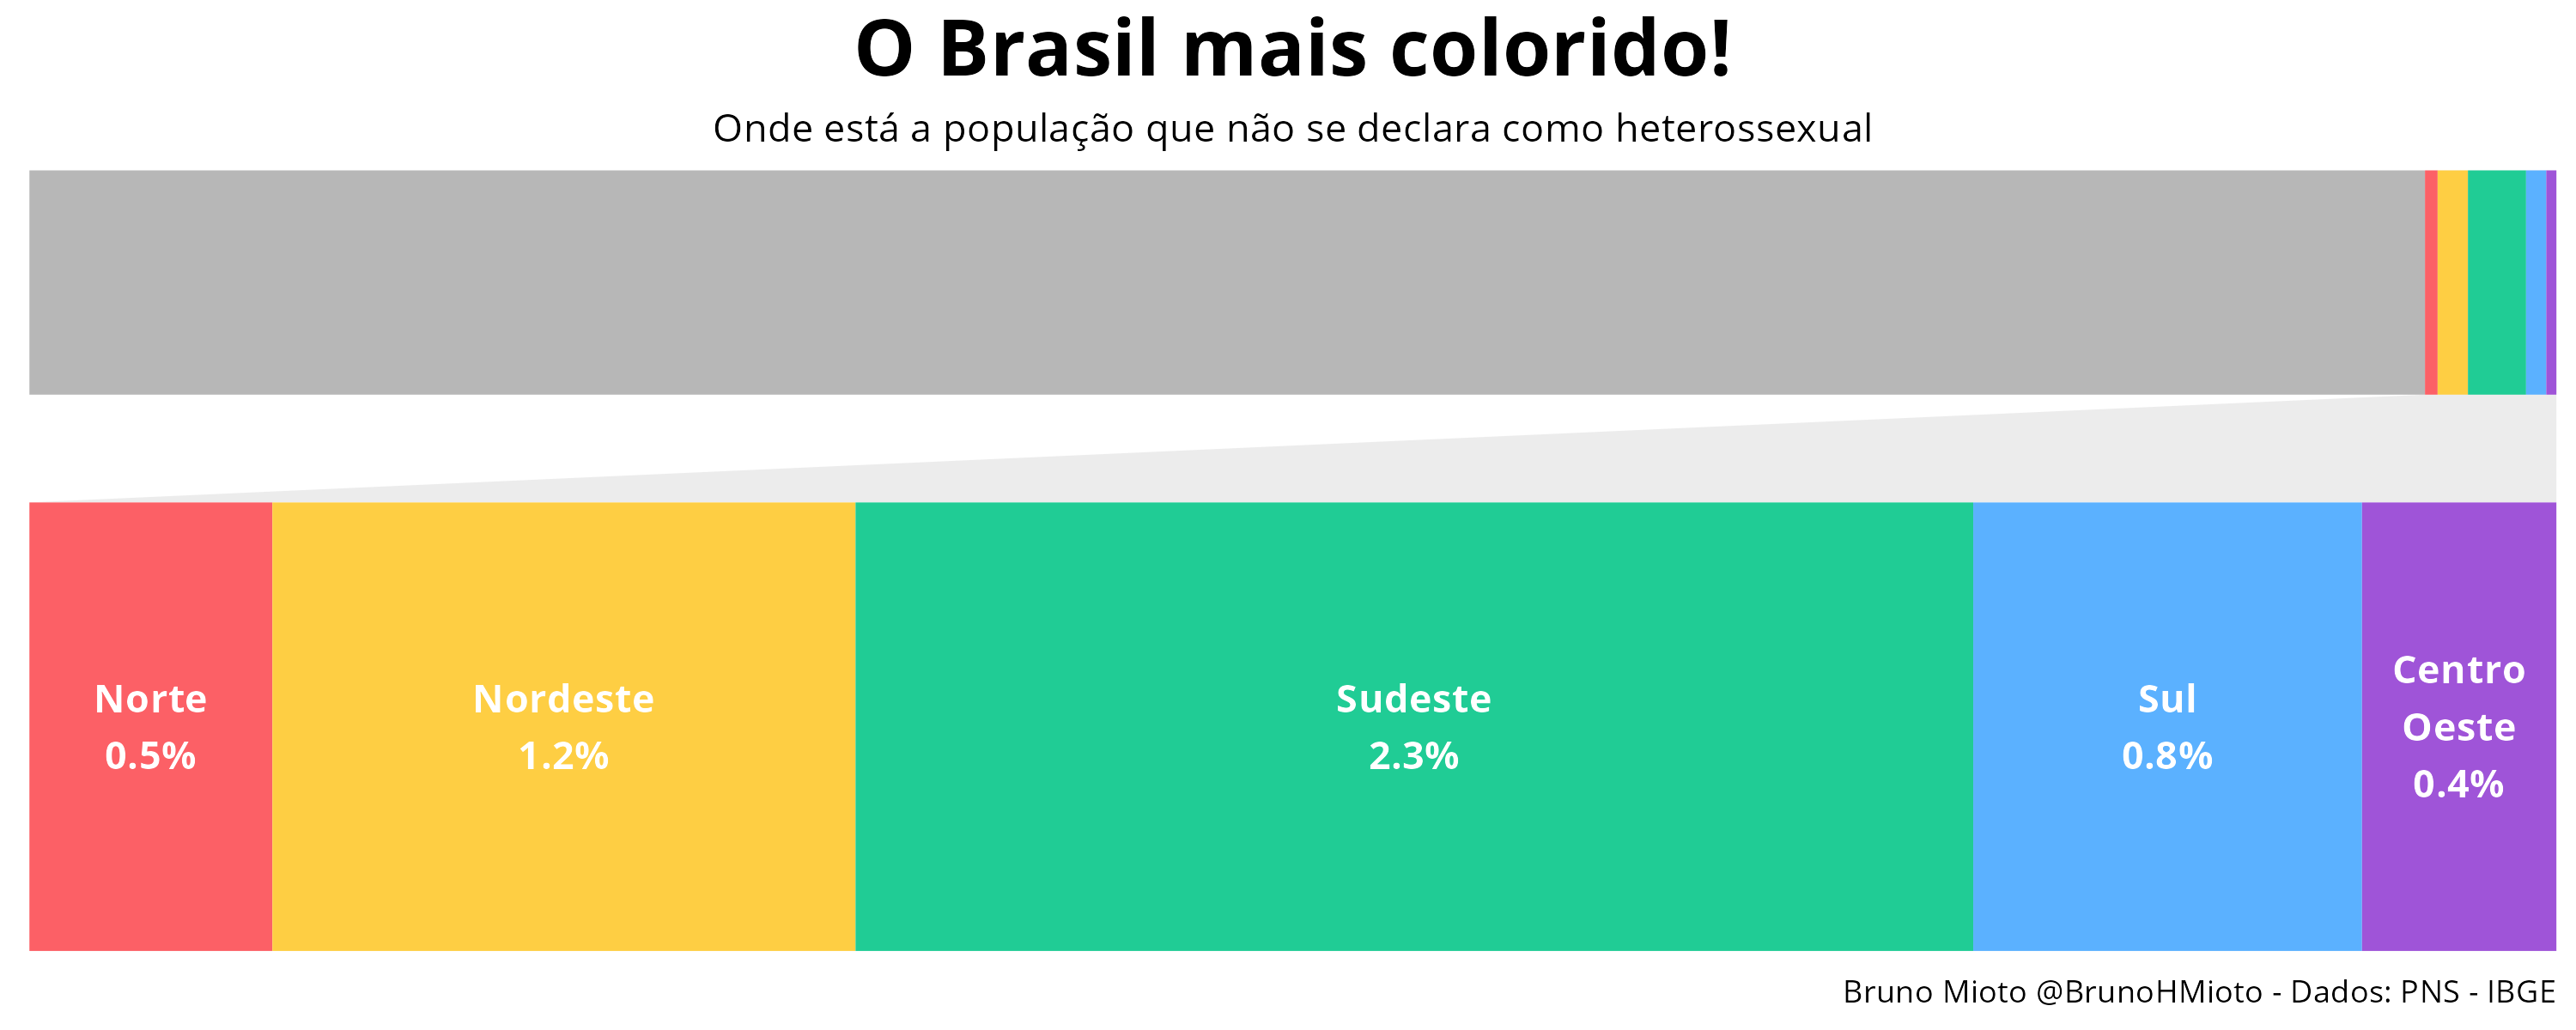
Kieling et al. (2024) - Worldwide Prevalence and Disability From Mental Disorders Across Childhood and Adolescence Evidence From the Global Burden of Disease Study

Kieling et al. (2024) - Worldwide Prevalence and Disability From Mental Disorders Across Childhood and Adolescence Evidence From the Global Burden of Disease Study

Martins et al. (2024) - Iterative taxonomy reveals a new species of Cambeva (Siluriformes: Trichomycteridae) with intraspecific variation from the rio Piquiri and Ivaí basin, upper rio Paraná basin, Brazil

Martins et al. (2024) - Iterative taxonomy reveals a new species of Cambeva (Siluriformes: Trichomycteridae) with intraspecific variation from the rio Piquiri and Ivaí basin, upper rio Paraná basin, Brazil

Original charts

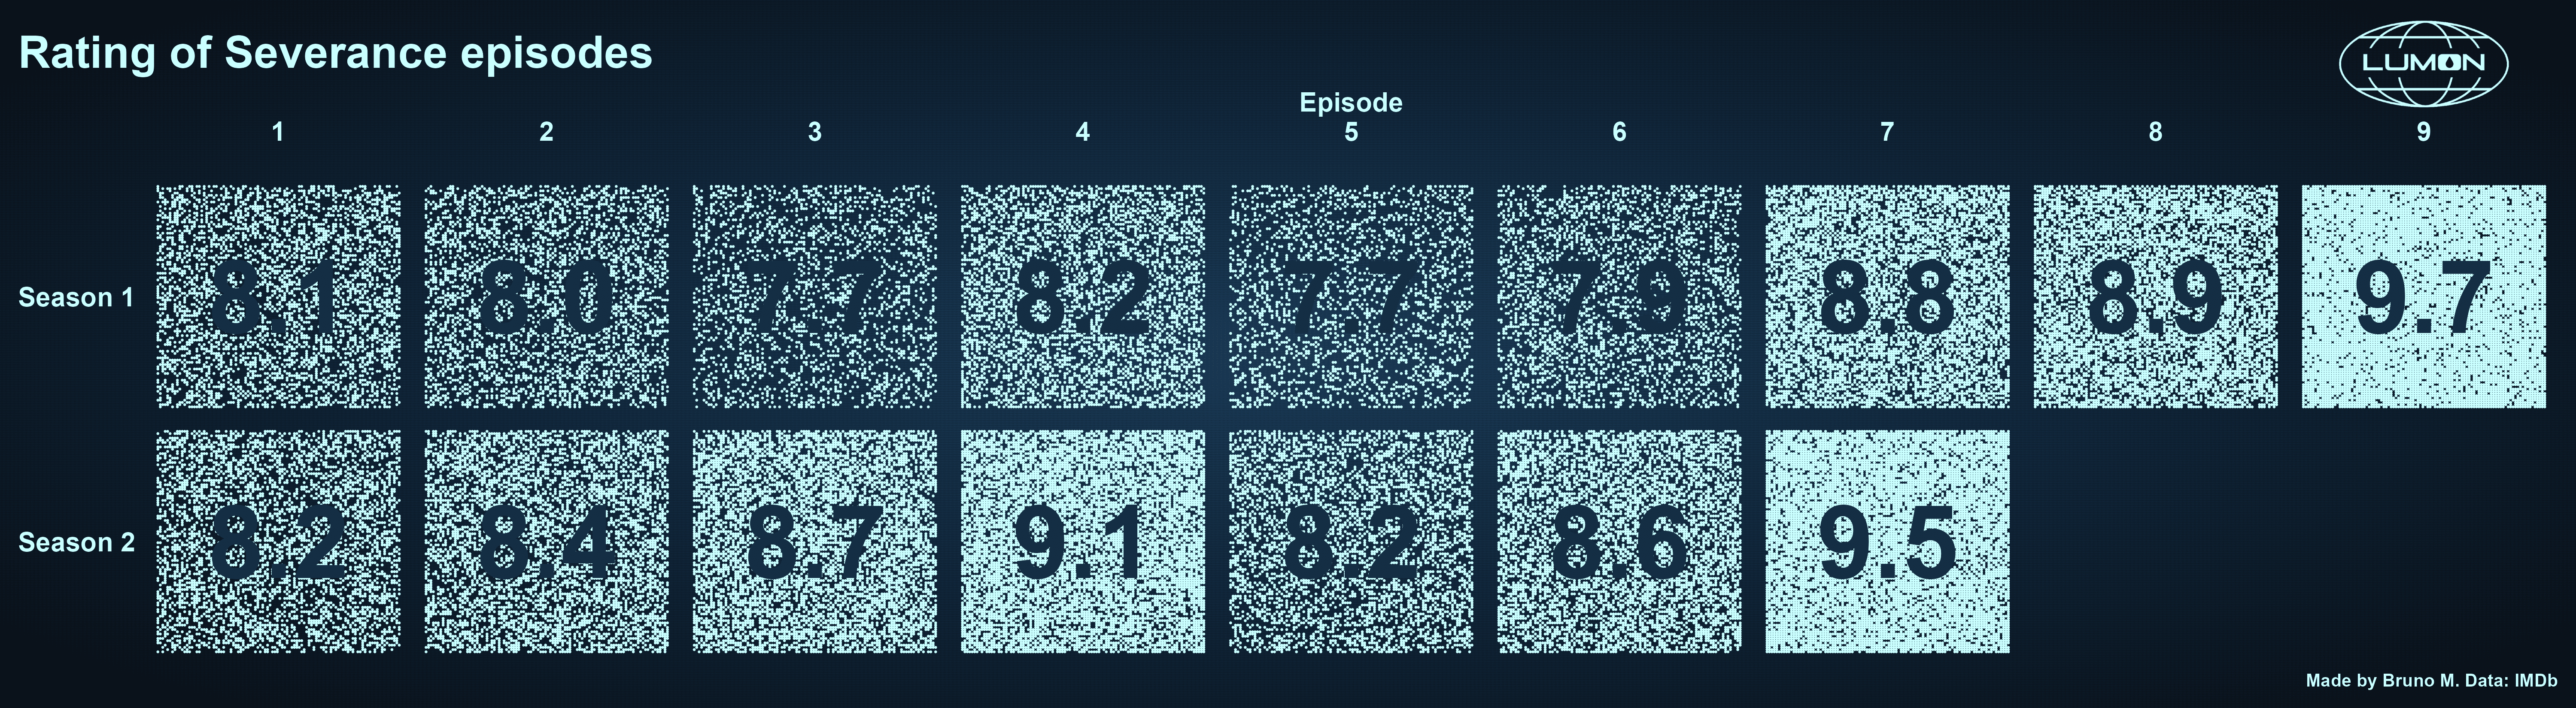
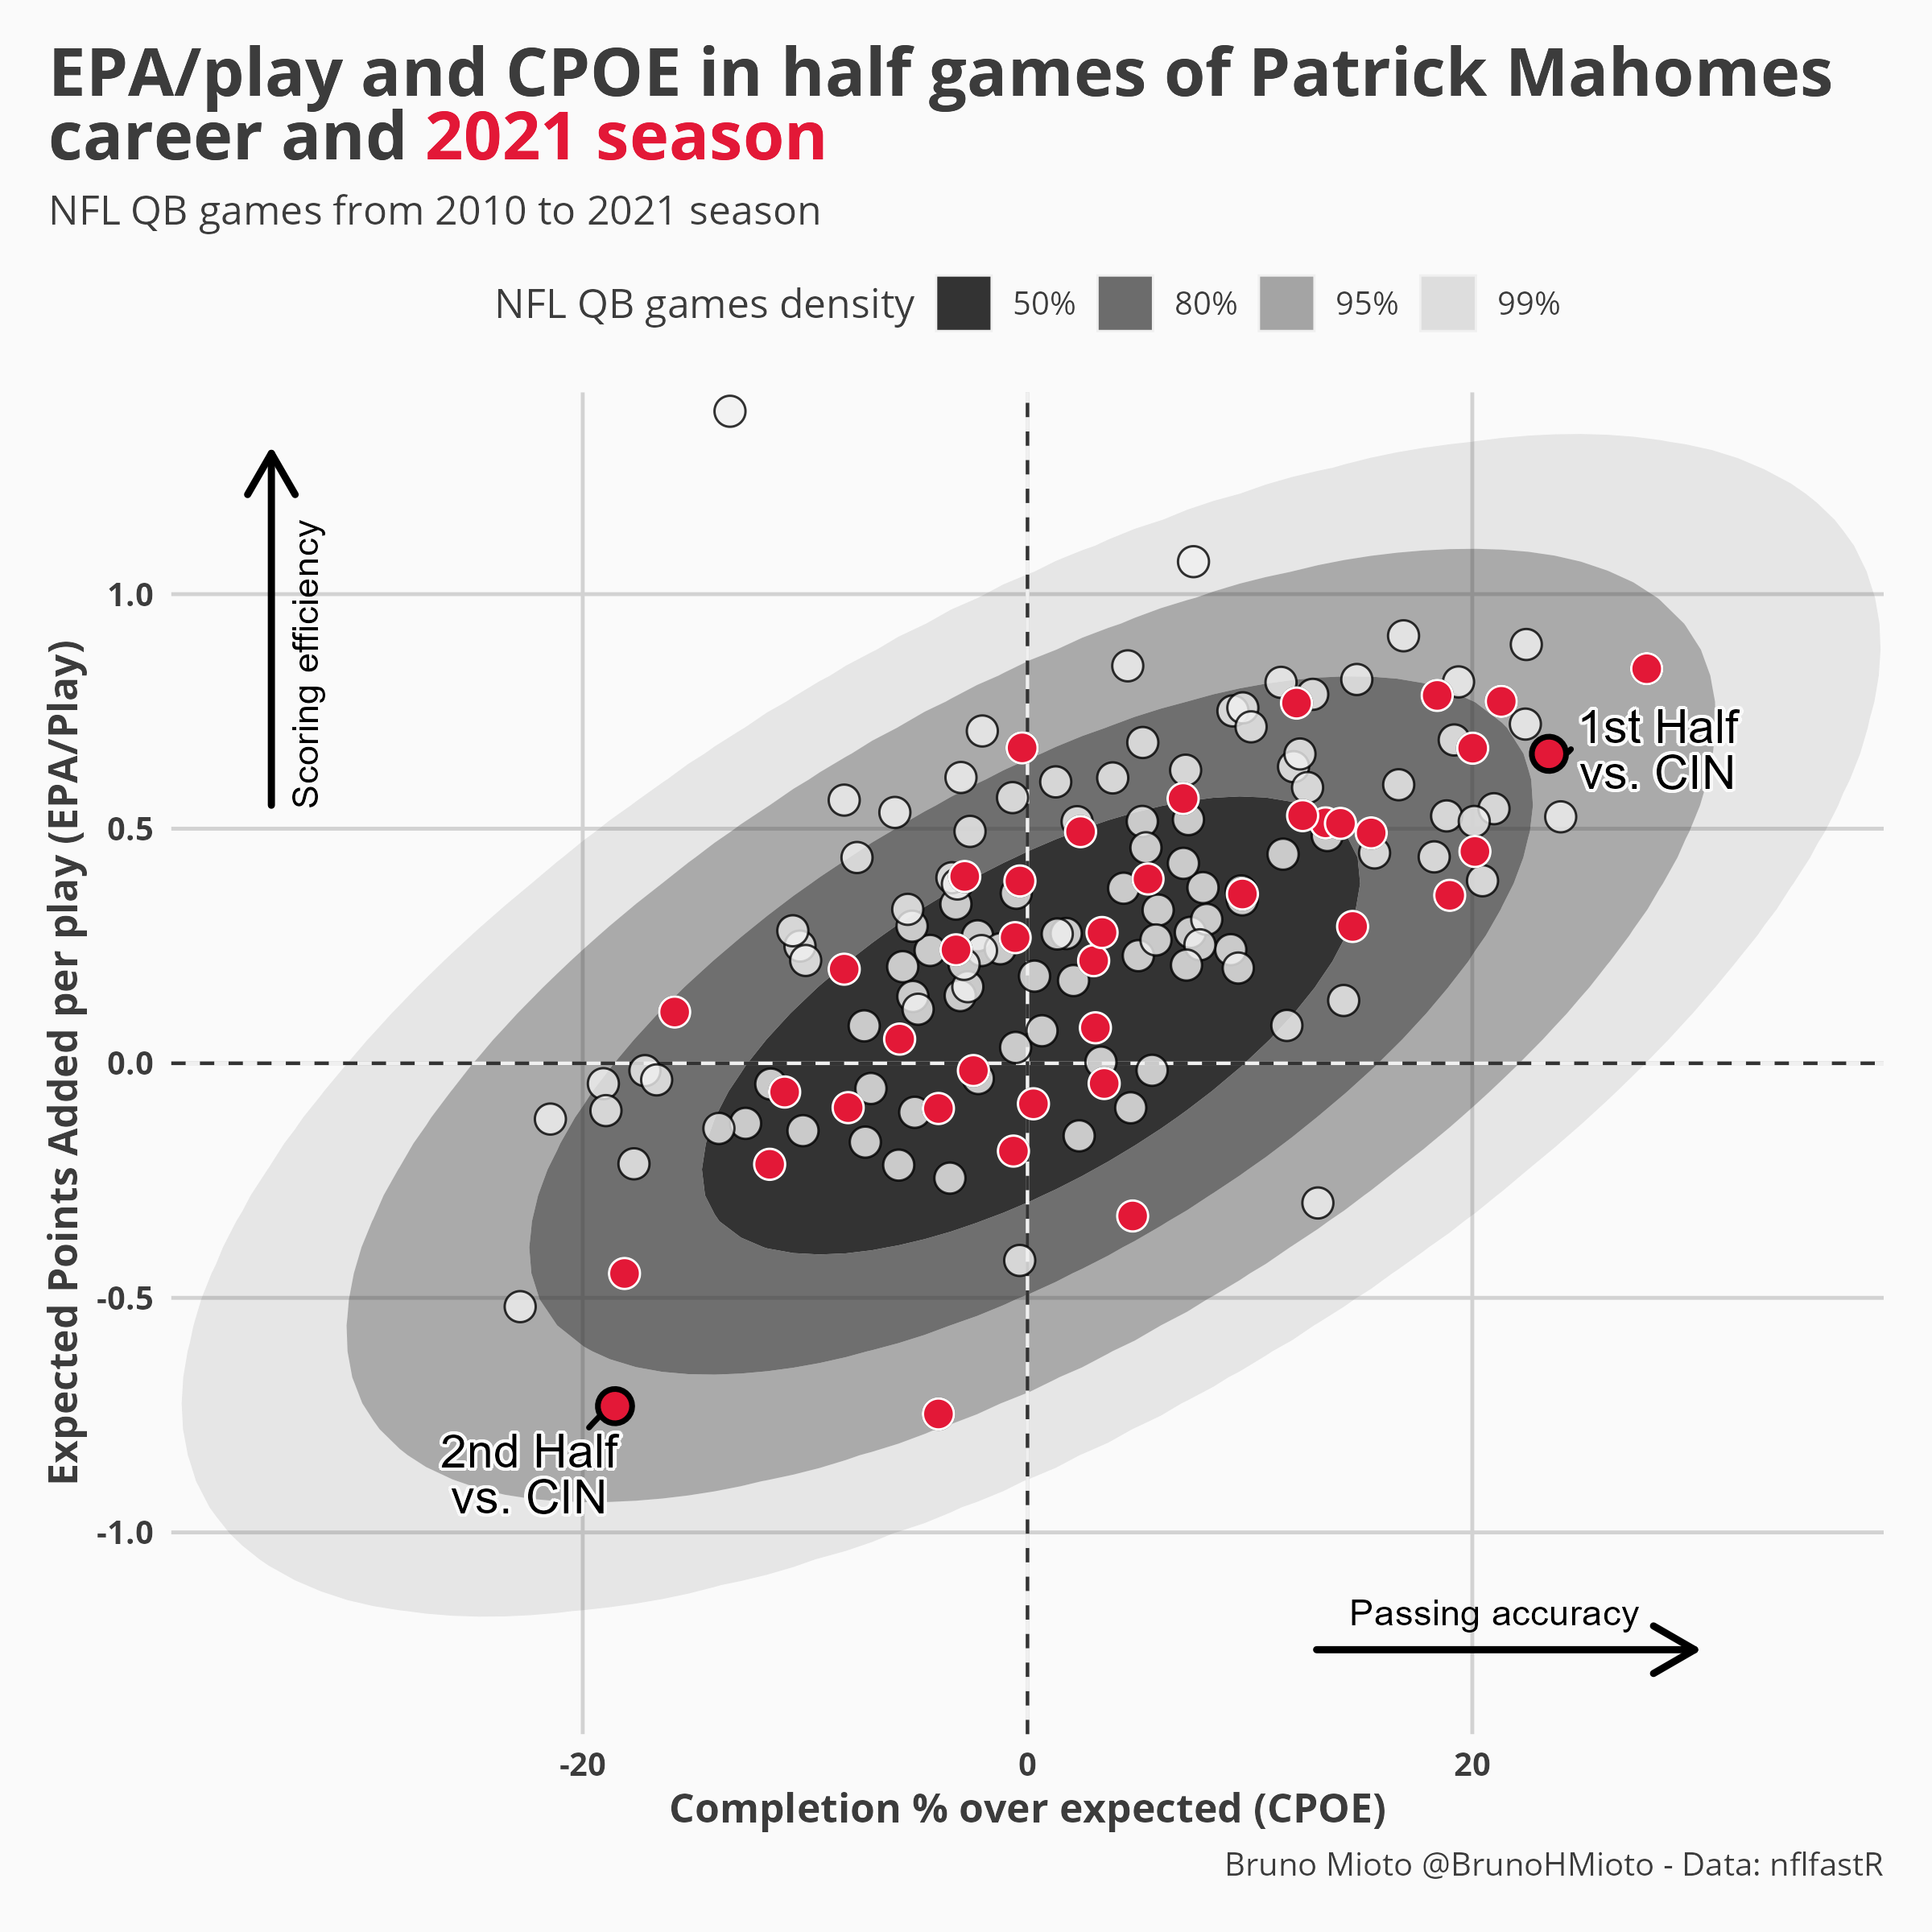
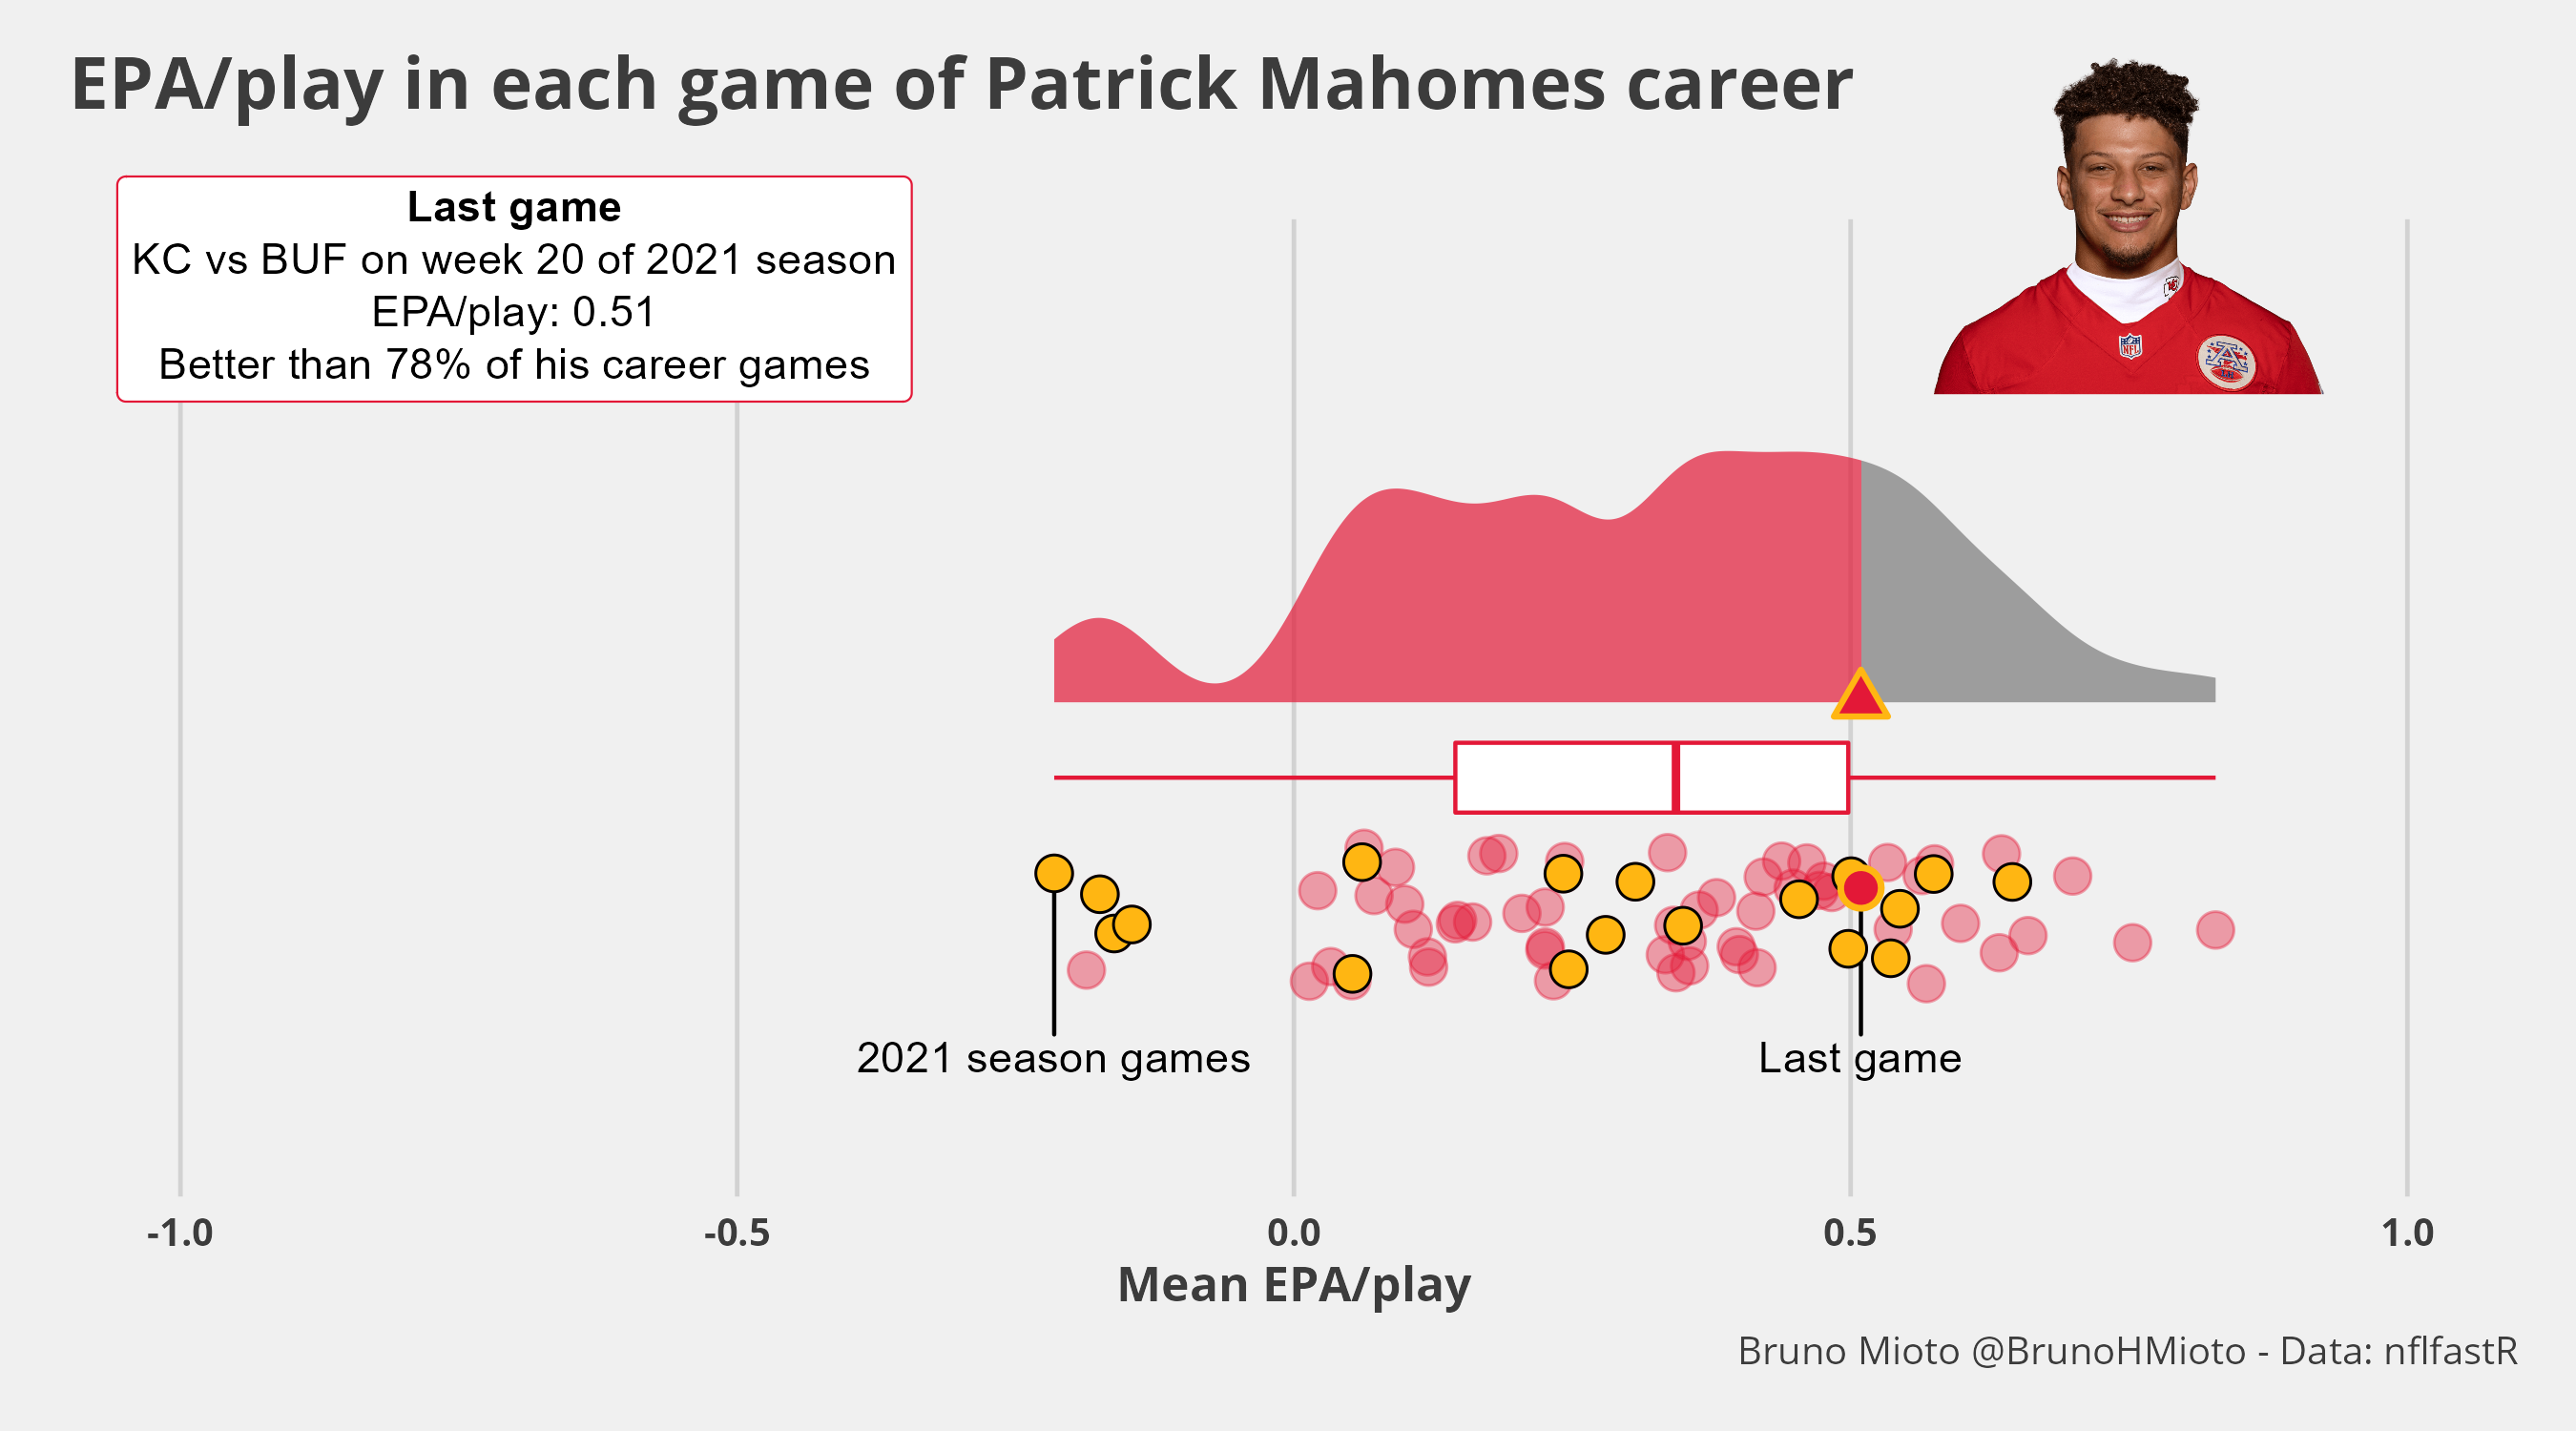
All the following charts and maps were made entirely using ggplot2/R.
You can click on each plot to see each detail.

Play animation made for BigDataBowl ’24 Competition

Play animation made for BigDataBowl ’24 Competition

I wrote a text for basedosdados with a tutorial on how I made this chart of the vaccinated population using R! Check it out here!

I also published a chart together with Nexo Jornal about inflation and unemployment in Brazil, updating a very interesting chart! Check it out here!

I made this animation for the BigDataBowl ’24 Competition. You can see my team’s notebook at Kaggle

Website made with Quarto by Bruno Mioto, 2025.